
Abstracts
Intramuscular fat (IMF) influences important quality characteristics of meat, such as flavor, juiciness, palatability, odor and tenderness. Thus, the objective of this study was to apply the following image processing techniques to quantify the IMF in beef: palette; sampling, interval of coordinates; black and white threshold; and discriminant function of colors. Thirty-five samples of beef, with a wide range of IMF, were used. Color images were taken of the meat samples from different muscles, with variability in the IMF content. The IMF of a thin cross-section meat was determined by chemical lipid extraction and was predicted by image analysis. The chemical method was compared with the image analysis. The segmentation procedures were validated by the adjustment of a linear regression equation to the series of values that were observed and predicted, as well as the regression parameters evaluated by the F-test. The predictive power of these approaches was also compared by residual analysis and by the decomposition of the mean square deviations. The results showed that the discriminant function was the best color segmentation method to measure intramuscular fat via digital images, but required adjustments in the prediction pattern.
tissue characterization; meat industry; marbling; image processing; meat quality.
A gordura intramuscular (GIM) influencia importantes características qualitativas da carne, tais como: sabor, suculência, palatabilidade, odor e maciez. Assim, objetivou-se aplicar diferentes técnicas de processamento de imagem para quantificar a GIM na carne bovina: paleta, amostragem, intervalo de coordenadas, limiar de preto e branco e função discriminante de cores. Foram utilizadas 35 amostras de bifes com uma ampla gama de GIM. Foram capturadas imagens coloridas das amostras de carne de diferentes músculos com uma variabilidade no conteúdo de GIM. A gordura intramuscular da secção transversal e fina de carne foi determinada por extração química dos lipídios e predita por análise de imagem. O método químico foi comparado com a análise de imagem. Os procedimentos de segmentação foram validados pelo ajustamento de uma equação de regressão linear na série de valores observados e preditos e os parâmetros da regressão avaliados pelo teste F. O poder preditivo destas aproximações também foi comparado por meio de análise residual e pela decomposição do quadrado médio dos desvios. Os resultados mostraram que a função discriminante foi o melhor método de segmentação da cor para mensurar a gordura intramuscular via imagem digital, mas necessita de ajustes no padrão de predição.
caracterização tecidual; indústria cárnea; marmoreio; processamento de imagens; qualidade da carne.
INTRODUCTION:
The content of intramuscular fat, also known as "marbling", influences important meat quality characteristics, such as flavor, juiciness, palatability, odor and tenderness. The effect of marbling on tenderness is related to a decrease in the density of meat, lower tension between the layers of connective tissue, increased lubrication of proteins by lipids, and by the capacity of fat to stimulate salivation, all of which result in a more prolonged perception of juiciness (LAWRIE, 2005LAWRIE, R.A. Ciência da carne. 6.ed. Porto Alegre: ARTMED, 2005. 384p.). In addition, the visual appearance of fat, as well as its amount and distribution, also influence the overall acceptability of meat and therefore the choice of consumers prior to purchase.
Visual inspection is widely used in processes within the meat industry for the subjective assessment of quality, from initial classification until the time of purchase by consumers. However, the subjective methodologies of visual evaluation of beef are now being replaced by evaluation that is provided by images because the latter provide more reliability and better stratification of results (FERGUSON, 2004FERGUSON, D.M. Objective on-line assessment of marbling: a brief review. Australian Journal of Experimental Agriculture, v.44, n.7, p.681-685, 2004. Available from: <Available from: <http://www.publish.csiro.au/paper/EA02161.htm
>. Accessed: Apr. 22, 2015. doi: 10.1071/EA02161.
http://www.publish.csiro.au/paper/EA0216...
).
There are several techniques to quantify intramuscular fat (IMF) content, such as: chemical analysis (FOLCH et al., 1957FOLCH, J. et al. A simple method for the isolation and purification of total lipides from animal tissues. Journal of Biological Chemistry, v.226, n.1, p.497-509, 1957. Available from: <Available from: <http://www.jbc.org/content/226/1/497.full.pdf
>. Accessed: Apr. 22, 2015.
http://www.jbc.org/content/226/1/497.ful...
; BLIGH & DYER, 1959BLIGH, E.G.; DYER, W.J. A rapid method of total lipid extraction and purification. Canadian Journal of Biochemistry and Physiology, v.37, n.8, p.911-917, 1959. Available from: <Available from: <http://www.nrcresearchpress.com/doi/pdf/10.1139/o59-099
>. Accessed: Apr. 22, 2015. doi: 10.1139/o59-099.
http://www.nrcresearchpress.com/doi/pdf/...
; HARA & RADIN, 1978HARA, A.; RADIN, N.S. Lipid extraction of tissues of low toxicity solvent. Analytical Biochemistry, v.90, n.1, p.420-426, 1978. Available from: <http://dx.doi.org/10.1016/0003-2697(78)90046-5>. Accessed: Apr. 22, 2015. doi: 10.1016/0003-2697(78)90046-5.
https://doi.org/10.1016/0003-2697(78)900...
; AOAC, 2006); ultrasound (AASS et al., 2009AASS, L. et al. Ultrasound prediction of intramuscular fat content in lean cattle. Livestock Science, v.125, n.2-3, p.177-186, 2009. Available from: <Available from: <http://dx.doi.org/10.1016/j.livsci.2009.04.005
>. Accessed: Apr. 22, 2015. doi: 10.1016/j.livsci.2009.04.005.
http://dx.doi.org/10.1016/j.livsci.2009....
); electrical impedance (ALTMANN & PLIQUETT, 2006ALTMANN, M.; PLIQUETT, U. Prediction of intramuscular fat by impedance spectroscopy. Meat Science, v.72, p.666-671, 2006. Available from: <Available from: <http://dx.doi.org/10.1016/j.meatsci.2005.08.021
>. Accessed: Apr. 22, 2015. doi: 10.1016/j.meatsci.2005.08.021.
http://dx.doi.org/10.1016/j.meatsci.2005...
); computed tomography (LAMBE et al., 2010LAMBE, N.R. et al. Predicting intramuscular fat content of lamb loin fillets using CT scanning. In: DAUMAS, G. (Ed.) FARM ANIMAL IMAGING CONGRESS, 2010, Rennes, France. Proceedings... Rennes: IFIP - The French Pork and Pig Institute, 2010. p.9-10. Available from: <Available from: <https://www.researchgate.net/publication/264890331_Predicting_intramuscular_fat_content_of_lamb_loin_fillets_using_CT_scanning
>. Accessed: Apr. 22, 2015.
https://www.researchgate.net/publication...
); nuclear magnetic resonance (SANTOS et al., 2008SANTOS; E.S.B. et al. Análise de marmoreio de contra-filé através de imagens obtidas por tomografia de ressonância magnética. São Carlos: Embrapa Instrumentação Agropecuária, 2008. (Embrapa Instrumentação Agropecuária. Comunicado Técnico, 98).) and hyperspectral imaging (LIU & NGADI, 2014LIU, L.; NGADI, M.O. Predicting intramuscular fat content of pork using hyperspectral imaging. Journal of Food Engineering, v.134, p.16-23, 2014. Available from: <Available from: <http://www.sciencedirect.com/science/article/pii/S0260877414000740
>. Accessed: Apr. 22, 2015. doi: 10.1016/j.jfoodeng.2014.02.007.
http://www.sciencedirect.com/science/art...
). However, few of these methods are acceptable in terms of the quantification of fat in a cross-section of a slice of meat. In addition, few of these methods are satisfactory because they use large amounts of organic solvents, which are expensive, laborious, time consuming, tedious and invasive (destructive), all of which limit their industrial use.
There has been growing interest in the use of digital images in the agricultural and food industries. The processing and analysis of images has been the technology that has most recently been used for the quantification of IMF because it is a technique that is objective, fast, non-invasive (non-destructive), less costly and environmentally sustainable. Consequently, the objective of this study was to evaluate the predictive efficiency, in terms of IMF content, for different color segmentation procedures applied in the digital image processing of beef as a substitution for chemical analysis.
MATERIALS AND METHODS:
Thirty-five samples of beef were acquired commercially; they were 2.54 cm thick and the IMF content ranging from 0.80 to 7.85% (Table 1). The samples were collected from cross-sections of the following muscles: Gluteus medius (top sirloin cap, n=9); Biceps femoris (outside round, n =1); Semimembranosus (inside round, n =13); Longissimus dorsi (striploin, n =4); Semitendinosus (eye of round, n =4); and Quadriceps femoris (knuckle, n =4).
The images of the beef samples were taken using a FinePix S3200 (Fujifilm Corporation, Tokyo, Japan) digital camera with14 megapixels, 24x optical zoom and no flash. The meat samples were placed in a 20 × 20 × 15 cm cardboard box with a white background and without a cover; they were exposed to ambient lighting containing 16 fluorescent lamps (40W). The same exposure and focal length were used for all the images. The photographs were taken at a size of 4288 × 2416 pixels with resolution of 72 dots per inch (Figure 1A) on both sides of the slice of meat and near a measurement scale.
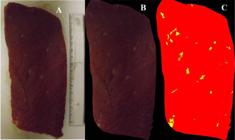
Original (A), background suppressed (B) and segmented (C) image from Biceps femoris muscle representative of the beef samples.
The images were processed using the QUANT v.1.0.2 program (VALE et al., 2002VALE, F.X.R. et al. QUANT: image processing software. Viçosa: Universidade Federal de Viçosa (UFV), 2002. Version 1.0.2.). There were four stages in the processing: calibration (ruler); removal of cover of fat and connective tissue; background suppression (Figure 1B); and segmentation of muscle regions and IMF (Figure 1C). To separate the fat from the muscle, five color segmentation procedures were used, which were based on their characteristics in three-dimensional colorimetric space (RGB) and the intrinsic nature of these structures, which are: the color palette, color sampling, coordinate range, black and white threshold, and discriminant function. During the procedure, the color black was assumed as the background, red as muscle, and yellow as fat (Figure 1C), except for the segmentation by black and white threshold, where the background was the color blue, the muscle was black and the fat was white. The quantification of IMF content was in the proportion (%) of the area occupied by these structures, without calculating the background.
After processing the images, the averages between the two sides of the piece were calculated and were compared using chemical analysis (HARA &RADIN, 1978HARA, A.; RADIN, N.S. Lipid extraction of tissues of low toxicity solvent. Analytical Biochemistry, v.90, n.1, p.420-426, 1978. Available from: <http://dx.doi.org/10.1016/0003-2697(78)90046-5>. Accessed: Apr. 22, 2015. doi: 10.1016/0003-2697(78)90046-5.
https://doi.org/10.1016/0003-2697(78)900...
).
The efficiency of prediction of the different procedures for image processing was evaluated by bias (difference between the mean of the predicted values and the mean of the observed values) and the mean percentage error (MPE), given by

,Where

is the percentage error for the i-th observation, assigning the function of underestimated (+) or overestimated (-) to the observed value.
In addition, the estimates generated by the different color segmentation procedures were validated by adjustment of simple linear regression equations in the range of the observed values (chemical analysis) and predicted values (image analysis) and the regression parameters evaluated by the F-test under the following simultaneous hypothesis test (MAYER et al., 1994MAYER, D.G. et al. Regression of real-world data on model output: an appropriate overall test of validity. Agriculture Systems, v.45, n.1, p.93-104, 1994. Available from: <Available from: <http://www.sciencedirect.com/science/article/pii/S0308521X94902828
>. Accessed: Apr. 22, 2015. doi: 10.1016/S0308-521X(94)90282-8.
http://www.sciencedirect.com/science/art...
): H0:β0 =0 and β1 =1 where, H0= null hypothesis; β0= intercept of the linear regression between the observed and predicted IMF content; and β1 = slope of line. If H0 is not rejected, it can be concluded that the procedure predicts the observed values with similarity (a=0.05).
The predictive power of the procedures was also evaluated by residual analysis (DRAPER & SMITH, 1966DRAPER, N.R.; SMITH, H. Applied regression analysis. New York: John Wiley & Sons, 1966. 407p.; MONTGOMERY, 2005MONTGOMERY, D.C. Design and analysis of experiments. 6.ed. New York: John Wiley & Sons, 2005.643p.; MITCHELL & SHEEHY, 1997MITCHELL, P.L.; SHEEHY, J.E. Comparison of predictions and observations to assess model performance: a method of empirical validation. In: KROPFF, M.J. et al. (Eds.). Applications of systems approaches at the field level. Netherlands: Kluwer Academic Publishers, 1997. p.437-451.) and through decomposition of mean square deviation prediction, as suggested by KOBAYASHI & SALAM (2000KOBAYASHI, K.; SALAM, M.U. Comparing simulated and measured values using mean squared deviation and its components. Agronomy Journal, v.92, n.2, p.345-352, 2000. Available from: <Available from: <https://www.agronomy.org/publications/aj/abstracts/92/2/345
>. Accessed: Apr. 22, 2015. doi: 10.2134/agronj2000.922345x.
https://www.agronomy.org/publications/aj...
) as follows:


In which: MSD = mean square deviation between predicted and observed values; SB = squared bias; SDSD= squared difference between standard deviations; LCS= lack of correlation weighted by standard deviations; xi = i-th predicted value; yi =i i i -th observed value; = mean of the predicted values; = mean of the observed values; Sx and Sy = standard errors for the predicted and observed values, respectively; and r= Pearson correlation coefficients between predicted and observed values. It should be noted that for all the calculations of variances, the total of observations (n) was used as a divisor. The prediction model was considered effective when it presented low values for SB, SDSD, and LCS.
RESULTS AND DISCUSSION:
The observed values of IMF ranged from 0.8% to 7.8%, with an average of 3.1%, and there was wide variation around the mean (coefficient of variation > 50%; Table 1), which reflected the reality of beef cuts usually sold in Brazil (PINHO et al., 2011PINHO, A.P.S. et al. Perfil lipídico da gordura intramuscular de cortes e marcas comerciais de carne bovina. Revista Brasileira de Zootecnia, v.40, n.5, p.1134-1142, 2011. Available from: <Available from: <http://www.scielo.br/scielo.php?script=sci_arttext&pid=S1516-35982011000500027
>. Accessed: Apr. 22, 2015. doi: 10.1590/S1516-35982011000500027.
http://www.scielo.br/scielo.php?script=s...
).
Discriminant function was the predictive method which obtained the mean that was closest to the observed mean and that resulted in a prediction with least bias (Table 1), i.e. with a systematic error that represented only 4.81% of the observed value. The low effect of bias in the prediction was due to the multidimensional representation of the adopted procedure, which made it possible to obtain data that fitted well to a simple level of description or the organization of hierarchy in biology (THORNLEY & FRANCE, 2007THORNLEY, J.H.M.; FRANCE, J. Mathematical models in agriculture: quantitative methods for the plant, animal and ecological sciences. 2.ed. Wallingford: CABI International, 2007. 906p.). However, the other procedures predicted lower averages than were observed; there were negative biases and also those that systematically higher (Table 1), which indicated significant underestimates.
However, the discriminant function had a higher mean percentage error (MPE) and a negative value, while the color palette had a lower MPE and a positive value (Table 1), demonstrating that the former overestimated (-) with a higher degree, while the latter underestimated (+) with a lower degree of error the observations of the data set. The lower bias and the higher MPE obtained by the discriminant function (Table 1) can be confirmed, respectively, by the lower squared bias (SB) and the higher value for the lack of correlation weighted by standard deviations (LCS) of the discriminant function in relation to the others (Figure 2). This indicates that, on average, the procedure was accurate but that around the mean it was inaccurate. In addition, it should be emphasized that this procedure predicted the magnitude of variation that was closest to that which was observed (minimum and maximum, Table 1; <SDSD, Figure 2).

Decomposition of the mean square deviation (MSD) for intramuscular fat in squared bias (SB), squared difference between standard deviations (SDSD) and lack of correlation weighted by the standard deviations (LCS) from distinct color segmentation procedures of digital images.
The F-test for the parameters of the regression equations of observed IMF values over the predicted values by color palette and discriminant function (Figure 3) confirmed non-rejection (P>0.05) of the established null hypothesis (H0:β0 =0 and β1 =1), which indicated that these procedures can be applied for the quantification of IMF. This fact can be confirmed by the closeness between the lines of least squares (dashed line) and equality (y=x) for these predictive methods (Figure 3). However, among the procedures tested, the only one that allowed for complete automation in image processing was the discriminant function, which makes it suitable application for industrial usage.

Relationship between observed (chemical analysis) and predicted (image analysis) values of intramuscular fat from distinct color segmentation procedures, and dispersion of the ordinary residues according to the observed values. The dashed line corresponds to least squares straight line.
The coefficient of determination (r2) ranged from 0.62 to 0.67 (Figure 3). It is known that the r2 indicates the accuracy of model, varying from 0 to 1, and that when it has a value of ≥ 0.70 it indicates that the model is well adjusted. All the r2 values generated by the different predictive methods were below expectations (<0.70), although the values were close, especially in the range of coordinates (r2 = 0.67).The models did not fit well, i.e. they had a certain degree of inaccuracy and this can be confirmed by the behavior observed in the mean square variation: MSV = SDSD + LCS (Figure 2).
The validation of the predictive models from the linear regression is an important method. However it is empirical because when there is a lot of dispersion of the points around the mean the rejection of the null hypothesis may be fail and the y=x axial tilt is different from 1 (MITCHELL, 1997MITCHELL, P.L.; SHEEHY, J.E. Comparison of predictions and observations to assess model performance: a method of empirical validation. In: KROPFF, M.J. et al. (Eds.). Applications of systems approaches at the field level. Netherlands: Kluwer Academic Publishers, 1997. p.437-451.); this is not recommended when there is uncertainty about the predicted values (TEDESCHI, 2006TEDESCHI, L.O. Assessment of the adequacy of mathematical models. Agricultural Systems, v.89, n.3, p.225-247, 2006. Available from: <Available from: <http://www.sciencedirect.com/science/article/pii/S0308521X05002568
>. Accessed: Apr. 22, 2015. doi: 10.1016/j.agsy.2005.11.004.
http://www.sciencedirect.com/science/art...
).
The dispersion of the ordinary residuals in relation to the observed values (Figure 3) was random around the axis corresponding to zero, but it made it possible to systematically identify the occurrence of overestimation in the levels lower than 2% and underestimation in the levels above 3% of IMF for all the studied procedures; i.e. there was a tendency to decline from 0.80 (sample) to 0.99 (discriminant function) in relation to IMF content. These results may indicate that such procedures are inadequate to predict levels of IMF; however, some adjustments are necessary due to wide and systematic dispersion of residues. As well as the fact that such behavior demonstrated a lack of adjustment of the procedures to the data and their inadequacy in describing the studied phenomenon, the absence of a parameter associated with curvilinear and non-linear relationships can be identified as the main negative factor in relation to prediction of the methods that were studied.
All the procedures had similar predictive power (MSD), with values ranging from 5.02 for the discriminant function to 5.61 for the black and white threshold (Figure 2). However, the discriminant function had a lower squared bias (<SB) and higher mean square variation (>MSV= SDSD + LCS) than the others (Figure 2). The latter was due to the greater lack of correlation weighted by the standard deviations (>LCS), given that it had lower square difference between the standard deviations (<SDSD). Although the difference in the SB and SDSD between the discriminant function and the other predictive methods was very high, this was not enough to reduce the prediction error (MSD) due to the poor performance of the LCS (> value), which counterbalanced such differences.
When comparing the observed and predicted values, the MSD value will be lower the closer it is to the simulation of measurement (> accuracy and precision). A higher MSV (SDSD + LCS) indicates that the procedure fails to simulate the measurement variability around the mean (<precision). A higher SDSD indicates that the procedure fails to simulate the magnitude of oscillation between n measurements. A higher LCS means that the procedure fails to simulate the variation pattern of n measurements (KOBAYASHI & SALAM 2000KOBAYASHI, K.; SALAM, M.U. Comparing simulated and measured values using mean squared deviation and its components. Agronomy Journal, v.92, n.2, p.345-352, 2000. Available from: <Available from: <https://www.agronomy.org/publications/aj/abstracts/92/2/345
>. Accessed: Apr. 22, 2015. doi: 10.2134/agronj2000.922345x.
https://www.agronomy.org/publications/aj...
). Therefore, the discriminant function requires adjustments in the prediction pattern of deviation of an observation based on the arithmetic mean of all the observations in the evaluated data set (>LCS, Figure 2). In other words, in the wide dispersion of data around the y=x equality line (Figure 3) to decrease the LCS and consequently reduce the mean square deviations (<MSD), allowing its use in the prediction of IMF by utilizing digital images. These adjustments can be obtained with greater control over the factors that affect the final quality of the images to be segmented, such as greater control over the brightness (luminosity) and opaqueness (opacity) by changing the lighting (UV light) and the use of polarizing filters when capturing images. This allows for better identification and removal of connective tissue in the stage prior to the segmentation of images, resulting in greater accuracy in the prediction of IMF content than other procedures, considering that the discriminant function has already demonstrated less systematic error (<SB) and simulated the same range (<SDSD).
CONCLUSION:
The discriminant function can be successfully used in digital image analysis to quickly predict the intramuscular fat content in beef with required accuracy for use in industrial conditions; it had a higher prediction efficiency compared to the other tested procedures for color segmentation.
- AASS, L. et al. Ultrasound prediction of intramuscular fat content in lean cattle. Livestock Science, v.125, n.2-3, p.177-186, 2009. Available from: <Available from: <http://dx.doi.org/10.1016/j.livsci.2009.04.005 >. Accessed: Apr. 22, 2015. doi: 10.1016/j.livsci.2009.04.005.
» http://dx.doi.org/10.1016/j.livsci.2009.04.005 - ALTMANN, M.; PLIQUETT, U. Prediction of intramuscular fat by impedance spectroscopy. Meat Science, v.72, p.666-671, 2006. Available from: <Available from: <http://dx.doi.org/10.1016/j.meatsci.2005.08.021 >. Accessed: Apr. 22, 2015. doi: 10.1016/j.meatsci.2005.08.021.
» https://doi.org/10.1016/j.meatsci.2005.08.021.» http://dx.doi.org/10.1016/j.meatsci.2005.08.021 - ASSOCIATION OF OFFICIAL ANALYTICAL CHEMISTS (AOAC). Official methods of analysis. 18.ed. Gaithersburg, 2006. 2590p.
- BLIGH, E.G.; DYER, W.J. A rapid method of total lipid extraction and purification. Canadian Journal of Biochemistry and Physiology, v.37, n.8, p.911-917, 1959. Available from: <Available from: <http://www.nrcresearchpress.com/doi/pdf/10.1139/o59-099 >. Accessed: Apr. 22, 2015. doi: 10.1139/o59-099.
» https://doi.org/10.1139/o59-099.» http://www.nrcresearchpress.com/doi/pdf/10.1139/o59-099 - DRAPER, N.R.; SMITH, H. Applied regression analysis. New York: John Wiley & Sons, 1966. 407p.
- FERGUSON, D.M. Objective on-line assessment of marbling: a brief review. Australian Journal of Experimental Agriculture, v.44, n.7, p.681-685, 2004. Available from: <Available from: <http://www.publish.csiro.au/paper/EA02161.htm >. Accessed: Apr. 22, 2015. doi: 10.1071/EA02161.
» https://doi.org/10.1071/EA02161.» http://www.publish.csiro.au/paper/EA02161.htm - FOLCH, J. et al. A simple method for the isolation and purification of total lipides from animal tissues. Journal of Biological Chemistry, v.226, n.1, p.497-509, 1957. Available from: <Available from: <http://www.jbc.org/content/226/1/497.full.pdf >. Accessed: Apr. 22, 2015.
» http://www.jbc.org/content/226/1/497.full.pdf - HARA, A.; RADIN, N.S. Lipid extraction of tissues of low toxicity solvent. Analytical Biochemistry, v.90, n.1, p.420-426, 1978. Available from: <http://dx.doi.org/10.1016/0003-2697(78)90046-5>. Accessed: Apr. 22, 2015. doi: 10.1016/0003-2697(78)90046-5.
» https://doi.org/10.1016/0003-2697(78)90046-5. - KOBAYASHI, K.; SALAM, M.U. Comparing simulated and measured values using mean squared deviation and its components. Agronomy Journal, v.92, n.2, p.345-352, 2000. Available from: <Available from: <https://www.agronomy.org/publications/aj/abstracts/92/2/345 >. Accessed: Apr. 22, 2015. doi: 10.2134/agronj2000.922345x.
» https://doi.org/10.2134/agronj2000.922345x.» https://www.agronomy.org/publications/aj/abstracts/92/2/345 - LAMBE, N.R. et al. Predicting intramuscular fat content of lamb loin fillets using CT scanning. In: DAUMAS, G. (Ed.) FARM ANIMAL IMAGING CONGRESS, 2010, Rennes, France. Proceedings... Rennes: IFIP - The French Pork and Pig Institute, 2010. p.9-10. Available from: <Available from: <https://www.researchgate.net/publication/264890331_Predicting_intramuscular_fat_content_of_lamb_loin_fillets_using_CT_scanning >. Accessed: Apr. 22, 2015.
» https://www.researchgate.net/publication/264890331_Predicting_intramuscular_fat_content_of_lamb_loin_fillets_using_CT_scanning - LAWRIE, R.A. Ciência da carne. 6.ed. Porto Alegre: ARTMED, 2005. 384p.
- LIU, L.; NGADI, M.O. Predicting intramuscular fat content of pork using hyperspectral imaging. Journal of Food Engineering, v.134, p.16-23, 2014. Available from: <Available from: <http://www.sciencedirect.com/science/article/pii/S0260877414000740 >. Accessed: Apr. 22, 2015. doi: 10.1016/j.jfoodeng.2014.02.007.
» https://doi.org/10.1016/j.jfoodeng.2014.02.007.» http://www.sciencedirect.com/science/article/pii/S0260877414000740 - MAYER, D.G. et al. Regression of real-world data on model output: an appropriate overall test of validity. Agriculture Systems, v.45, n.1, p.93-104, 1994. Available from: <Available from: <http://www.sciencedirect.com/science/article/pii/S0308521X94902828 >. Accessed: Apr. 22, 2015. doi: 10.1016/S0308-521X(94)90282-8.
» https://doi.org/10.1016/S0308-521X(94)90282-8.» http://www.sciencedirect.com/science/article/pii/S0308521X94902828 - MITCHEL, P.L. Misuse of regression for empirical validation of models. Agricultural Systems, v.54, n.3, p.313-326, 1997. Available from: <Available from: <http://www.sciencedirect.com/science/article/pii/S0308521X96000777 >. Accessed: Apr. 22, 2015. doi: 10.1016/S0308-521X(96)00077-7.
» https://doi.org/10.1016/S0308-521X(96)00077-7.» http://www.sciencedirect.com/science/article/pii/S0308521X96000777 - MITCHELL, P.L.; SHEEHY, J.E. Comparison of predictions and observations to assess model performance: a method of empirical validation. In: KROPFF, M.J. et al. (Eds.). Applications of systems approaches at the field level. Netherlands: Kluwer Academic Publishers, 1997. p.437-451.
- MONTGOMERY, D.C. Design and analysis of experiments. 6.ed. New York: John Wiley & Sons, 2005.643p.
- PINHO, A.P.S. et al. Perfil lipídico da gordura intramuscular de cortes e marcas comerciais de carne bovina. Revista Brasileira de Zootecnia, v.40, n.5, p.1134-1142, 2011. Available from: <Available from: <http://www.scielo.br/scielo.php?script=sci_arttext&pid=S1516-35982011000500027 >. Accessed: Apr. 22, 2015. doi: 10.1590/S1516-35982011000500027.
» https://doi.org/10.1590/S1516-35982011000500027.» http://www.scielo.br/scielo.php?script=sci_arttext&pid=S1516-35982011000500027 - SANTOS; E.S.B. et al. Análise de marmoreio de contra-filé através de imagens obtidas por tomografia de ressonância magnética. São Carlos: Embrapa Instrumentação Agropecuária, 2008. (Embrapa Instrumentação Agropecuária. Comunicado Técnico, 98).
- TEDESCHI, L.O. Assessment of the adequacy of mathematical models. Agricultural Systems, v.89, n.3, p.225-247, 2006. Available from: <Available from: <http://www.sciencedirect.com/science/article/pii/S0308521X05002568 >. Accessed: Apr. 22, 2015. doi: 10.1016/j.agsy.2005.11.004.
» https://doi.org/10.1016/j.agsy.2005.11.004» http://www.sciencedirect.com/science/article/pii/S0308521X05002568 - THORNLEY, J.H.M.; FRANCE, J. Mathematical models in agriculture: quantitative methods for the plant, animal and ecological sciences. 2.ed. Wallingford: CABI International, 2007. 906p.
- VALE, F.X.R. et al. QUANT: image processing software. Viçosa: Universidade Federal de Viçosa (UFV), 2002. Version 1.0.2.
Publication Dates
-
Publication in this collection
Oct 2015
History
-
Received
07 Nov 2014 -
Accepted
24 Feb 2015


