Photocatalytic Performance of Green-Synthesized ZnO-ALE/PS Nanofilters for Methylene Blue Degradation
Abstract
This study evaluates the photocatalytic performance of ZnO/PS and ZnO-ALE/PS nanofilters, in which zinc oxide (ZnO) nanoparticles were green-synthesized using Aloe vera extract (ALE) and subsequently incorporated into polystyrene (PS) nanofibers. These nanofilters operate as a dual-function system, providing both a physical barrier for particulate retention and photocatalytic degradation of dyes under UV irradiation. The ZnO-ALE/PS filters exhibited enhanced dye removal efficiency compared to filters prepared with conventionally synthesized ZnO. UV-Vis spectroscopy revealed a distinct shift in the absorption spectrum, with ZnO@ALE showing pronounced absorption near 210 nm, overlapping with the characteristic ZnO peak at 360 nm, suggesting plasmonic band contributions. Structural and compositional analyses by SEM, FTIR, and EDS confirmed the successful integration and morphological optimization of the nanofibers for water purification applications. These findings demonstrate the potential of green-synthesized ZnO-ALE/PS nanofilters as an efficient, sustainable, and environmentally friendly approach for wastewater treatment, with broad relevance in the fields of nanotechnology and environmental remediation.
Keywords:
Green synthesis; Zinc oxide nanoparticles (ZnO); Photocatalysis; Aloe vera extract; Nanofibers for wastewater treatment
1. Introduction
The textile industry has experienced significant global growth in recent years1,2. However, this expansion has led to the generation of substantial amounts of synthetic waste, particularly from denim production, with dyes often being improperly and illegally discharged into nearby rivers. This issue is further exacerbated in clandestine laundries, where oversight and regulation are absent3.
In recent years, numerous studies have focused on addressing contaminant removal, utilizing methods such as filtration4, sedimentation5, degradation6, and bioremediation7. Among these, photocatalytic degradation has gained significant attention in the scientific community, leveraging light as a "trigger" to activate a catalytic reaction. Zinc oxide (ZnO) stands out as a promising photocatalyst due to its photoactive properties, attributed to its characteristic band gap in the UV region at 360 nm8,9. Beyond photocatalysis, ZnO is also widely used in sunscreens for its broad UV absorption capabilities and has demonstrated considerable potential in utilizing solar radiation for the degradation of organic matter10.
The degradation kinetics of dyes, based on the properties of ZnO, have been widely studied11-14. In recent years, green synthesis methods for preparing metal oxides have gained significant attention due to their use of safer reagents in smaller quantities, aligning with environmental preservation goals15-17. Various techniques for synthesizing nanostructured ZnO are well-documented, including thermal decomposition of organic precursors18, electrodeposition19, microwave-assisted synthesis20, hydrothermal methods21, and coprecipitation22. Among these, plant-mediated synthesis stands out as a faster and more efficient alternative compared to microorganism-based approaches23.
This project investigates the synthesis of nanostructured ZnO using a gel extracted from Aloe vera (ALE), a succulent plant of the Aloe genus24, widely known in Brazil as "babosa" and abundant in the state of Pernambuco. The ALE gel contains a diverse range of phytochemicals, including polysaccharides, flavonoids, tannins, enzymes, and phenolic compounds, which serve as both reducing and stabilizing agents during the synthesis of metal nanoparticles. These bioactive constituents facilitate the nucleation and controlled growth of ZnO nanoparticles, leading to more uniform and stable structures. Notably, the use of ALE extract has shown high efficacy in enhancing the colloidal stability of ZnO nanoparticles, significantly reducing their tendency to precipitate compared to particles synthesized without the extract25. This enhanced stability increases their effectiveness in industrial wastewater decontamination. Furthermore, integrating ZnO nanoparticles into a polymeric matrix broadens their application potential by improving material processability. This strategy facilitates the production of ZnO and polystyrene (PS) nanocomposite fibers, offering a combination of advanced functionality and enhanced manufacturability.
PS is a conventional, moldable polymer, unlike ZnO nanoparticles, which typically appear as a white powder. Using the electrospinning method, ZnO nanofibers can be fabricated with PS (ZnO/PS) and ALE (ZnO-ALE/PS). This technique involves injecting polymer solutions or melts through a syringe, where a high-voltage electric field applied between the needle tip and a metal collector forms nanometric fibers. This process enables the creation of ultra-efficient filters with extremely small pores.
The combination of ZnO with PS produces filters with dual functionality for wastewater treatment. First, the nanofibers act as a physical barrier, blocking contaminant particles. Second, the ZnO nanoparticles, activated by solar radiation, facilitate the photocatalytic degradation of soluble dyes, enhancing the filter’s overall efficiency.
Although numerous studies have investigated the photocatalytic activity of ZnO, the novelty of this work lies in two key aspects: (i) the green synthesis of ZnO nanoparticles using ALE extract as both a reducing and stabilizing agent and (ii) the incorporation of these nanoparticles into a PS nanofiber matrix for application in photocatalytic dye degradation processes.
2. Experimental
2.1. Materials
The materials used in this study included zinc acetate dihydrate (Zn(CH3CO2)2·2H2O) from Êxodo Científica, Brazil; sodium hydroxide (NaOH) from Dinâmica, Brazil; PS; and dimethylformamide (DMF) from Artquímica. All reagents were of P.A. (pure for analysis) grade and were used without prior purification.
2.2. Synthesis of ZnO and ZnO-ALE nanoparticles
2.2.1. ZnO synthesis
Two solutions were prepared: one containing 1.0 M Sodium Hydroxide (NaOH) and the other 0.3 M Zinc Acetate dihydrate (Zn(CH3CO2)2·2H2O). For the NaOH solution, 0,1 mol of NaOH was dissolved in 100 mL of distilled water with vigorous stirring to ensure complete dissolution. For the Zn(CH3CO2)2·2H2O solution, 0,05 mol of zinc acetate dihydrate was dissolved in 160 mL of distilled water under vigorous stirring until fully dissolved.
The Zn(CH3CO2)2·2H2O solution was transferred to a flask and stirred for 10 minutes at 60 °C. The NaOH solution was gradually added until the pH reached 10, causing the solution to change color from transparent to white. The mixture was stirred continuously for an additional 3 hours at 60 °C. Afterward, the reaction mixture was allowed to rest at room temperature for 24 hours, facilitating the precipitation of ZnO and the formation of a supernatant.
The supernatant was removed and discarded via vacuum filtration. The resulting precipitate was transferred to a muffle furnace and heated at 80 °C for 24 hours. Finally, the dried precipitate was ground into a homogeneous powder and characterized using ultraviolet-visible spectroscopy.
2.2.2. Synthesis of ZnO-ALE
The ZnO with ALE extract (ZnO-ALE) nanoparticles were synthesized using a green method designed to minimize environmental impact and promote sustainability in material production. ALE, known for its medicinal properties and wide availability, was used as a sustainable alternative to facilitate nanoparticle synthesis. Compounds naturally present in ALE, such as polysaccharides and phenolic compounds, acted as reducing and stabilizing agents during nanoparticle formation.
The synthesis procedure for ZnO-ALE followed the same steps as described for pure ZnO, with one key difference: the addition of 40 mL of ALE extract to the Erlenmeyer flask containing Zn(CH3CO2)2·2H2O before adding sodium hydroxide. To prepare the extract, 30 g of ALE leaves were cut into cubes, blended with 40 mL of distilled water for 5 minutes, and then filtered to remove the pulp, retaining the liquid extract for use in the synthesis.
2.3. Preparation method of ZnO/PS and ZnO-ALE/PS nanofilters
To prepare ZnO/PS_NF and ZnO-ALE/PS nanofilters, a suspension of PS in DMF at a concentration of 15% (w/w) was first prepared. The system was stirred until the PS was fully dissolved. Subsequently, ZnO or ZnO-ALE nanoparticles (prepared as described earlier) were added to the suspension at a ratio of 30% relative to the PS mass. The mixture was stirred for 4 hours at room temperature to ensure uniform dispersion.
The resulting emulsion was then loaded into a syringe fitted with a needle. A high-voltage power supply was connected, with the positive terminal attached to the needle tip and the negative terminal to a metal collector. A voltage of 7 kV was applied, and the distance between the syringe tip and the collector was set at 4 cm. The preparation time for the nanostructured filters varied based on experimentation, with durations of 1, 2, 3 minutes, and so on. As the fibers were deposited onto the substrate, they dried rapidly, forming fine, nanostructured fibers composed of ZnO-ALE/PS or ZnO/PS.
The results showed that the duration of high-voltage application has a significant impact on the morphology and properties of the nanofilters. Shorter application times, such as 1 minute, produced thinner films, while longer times, like 3 minutes, resulted in thicker films. Additionally, it was observed that fibers formed with only ZnO/PS were deposited directly onto the counter electrode, whereas those containing ZnO-ALE/PS were attracted to the positive pole, i.e., the needle tip, during their formation. This behavior suggests a potential modification in the electric properties of the fibers due to the incorporation of ALE during the nanoparticle synthesis, compared to fibers containing only ZnO.
2.4. Photodegradation test
For the decontamination tests with pure ZnO nanoparticles, a simplified photocatalytic reactor was designed to minimize interference from external light. The reactor setup included a UV lamp positioned 5 cm from the beaker, with the interior of the box lined with aluminum foil to enhance light reflection. A small opening was created to securely attach the lamp. After reactor assembly, the degradation process was initiated by adding 1,23 x 10⁻⁴ mol g of ZnO nanoparticles to artificially contaminated water containing methylene blue (MB) (1.2 × 10⁻⁶ M; purity ≥ 99%, Malinckrodt), commonly used in laboratory applications. The system was then exposed to UV radiation at a wavelength of 254 nm emitted by the UV lamp. Absorbance measurements were recorded at 15-minute intervals using a spectrophotometer to monitor the degradation process.
For the tests with ZnO/PS and ZnO-ALE/PS filters, sandy particles were added to the contaminated water to simulate complex effluent conditions. The filters were positioned at the tip of a syringe without a needle, and the contaminated suspension was loaded into the syringe. By pushing the plunger, the liquid was forced through the filter. The filtered liquid was then analyzed using UV-Vis spectroscopy. In a second step, the same procedure was repeated; however, this time, the system was exposed to UV radiation at 254 nm during filtration. UV-Vis spectroscopy measurements were taken again to evaluate the effect of photocatalytic degradation under UV exposure.
2.5. Characterizations
Morphological analyses were performed using an MIRA3 scanning electron microscope (TESCAN, Czech Republic). To prepare the samples, they were coated with a 20 nm layer of palladium-gold using a SC7620 mini coater (Quorum Technologies, UK) and mounted on a sample holder with carbon double-sided tape. The compositional distribution of chemical elements in the composites was qualitatively analyzed through energy dispersive spectroscopy (EDS).
Attenuated total reflectance Fourier transform infrared (FTIR-ATR) analysis was performed using an IRTracer-100 spectrophotometer (Shimadzu, Japan) over a spectral range of 4000 cm−1 to 400 cm−1. Optical characterization was conducted with a CARY spectrophotometer (Agilent, United States), covering the range of 200 nm to 800 nm, using quartz cuvettes with a 1 cm optical path. Colloidal dispersions of ZnO and ZnO-ALE nanoparticles were prepared in distilled water to acquire the spectra. To avoid spectral aberrations, the solutions were diluted to maintain absorbance levels below 0.5.
Additionally, X-ray diffraction (XRD) was used to identify the crystalline phase and confirm the presence of ZnO nanoparticles, as well as to check for possible structural changes after the addition of ALE. The average crystallite size (tc) was calculated using the Scherrer equation26, which relates the crystallite size to the broadening of X-ray diffraction peaks,
In this equation, k represents the Scherrer constant (with a value of 0.91 used in this study), λ is the wavelength of the radiation used, β denotes the full width at half maximum (FWHM) of the diffraction peak, and θ is the Bragg angle. This method provides an estimate of crystallite size by analyzing the diffraction peak broadening, which can result from the small size of crystallites or lattice imperfections.
The full width at half maximum (FWHM) of the sample under study was adjusted by applying a correction factor based on the FWHM of a standard SiO2 sample.
3. Results and Discussion
3.1. UV-Vis characterization
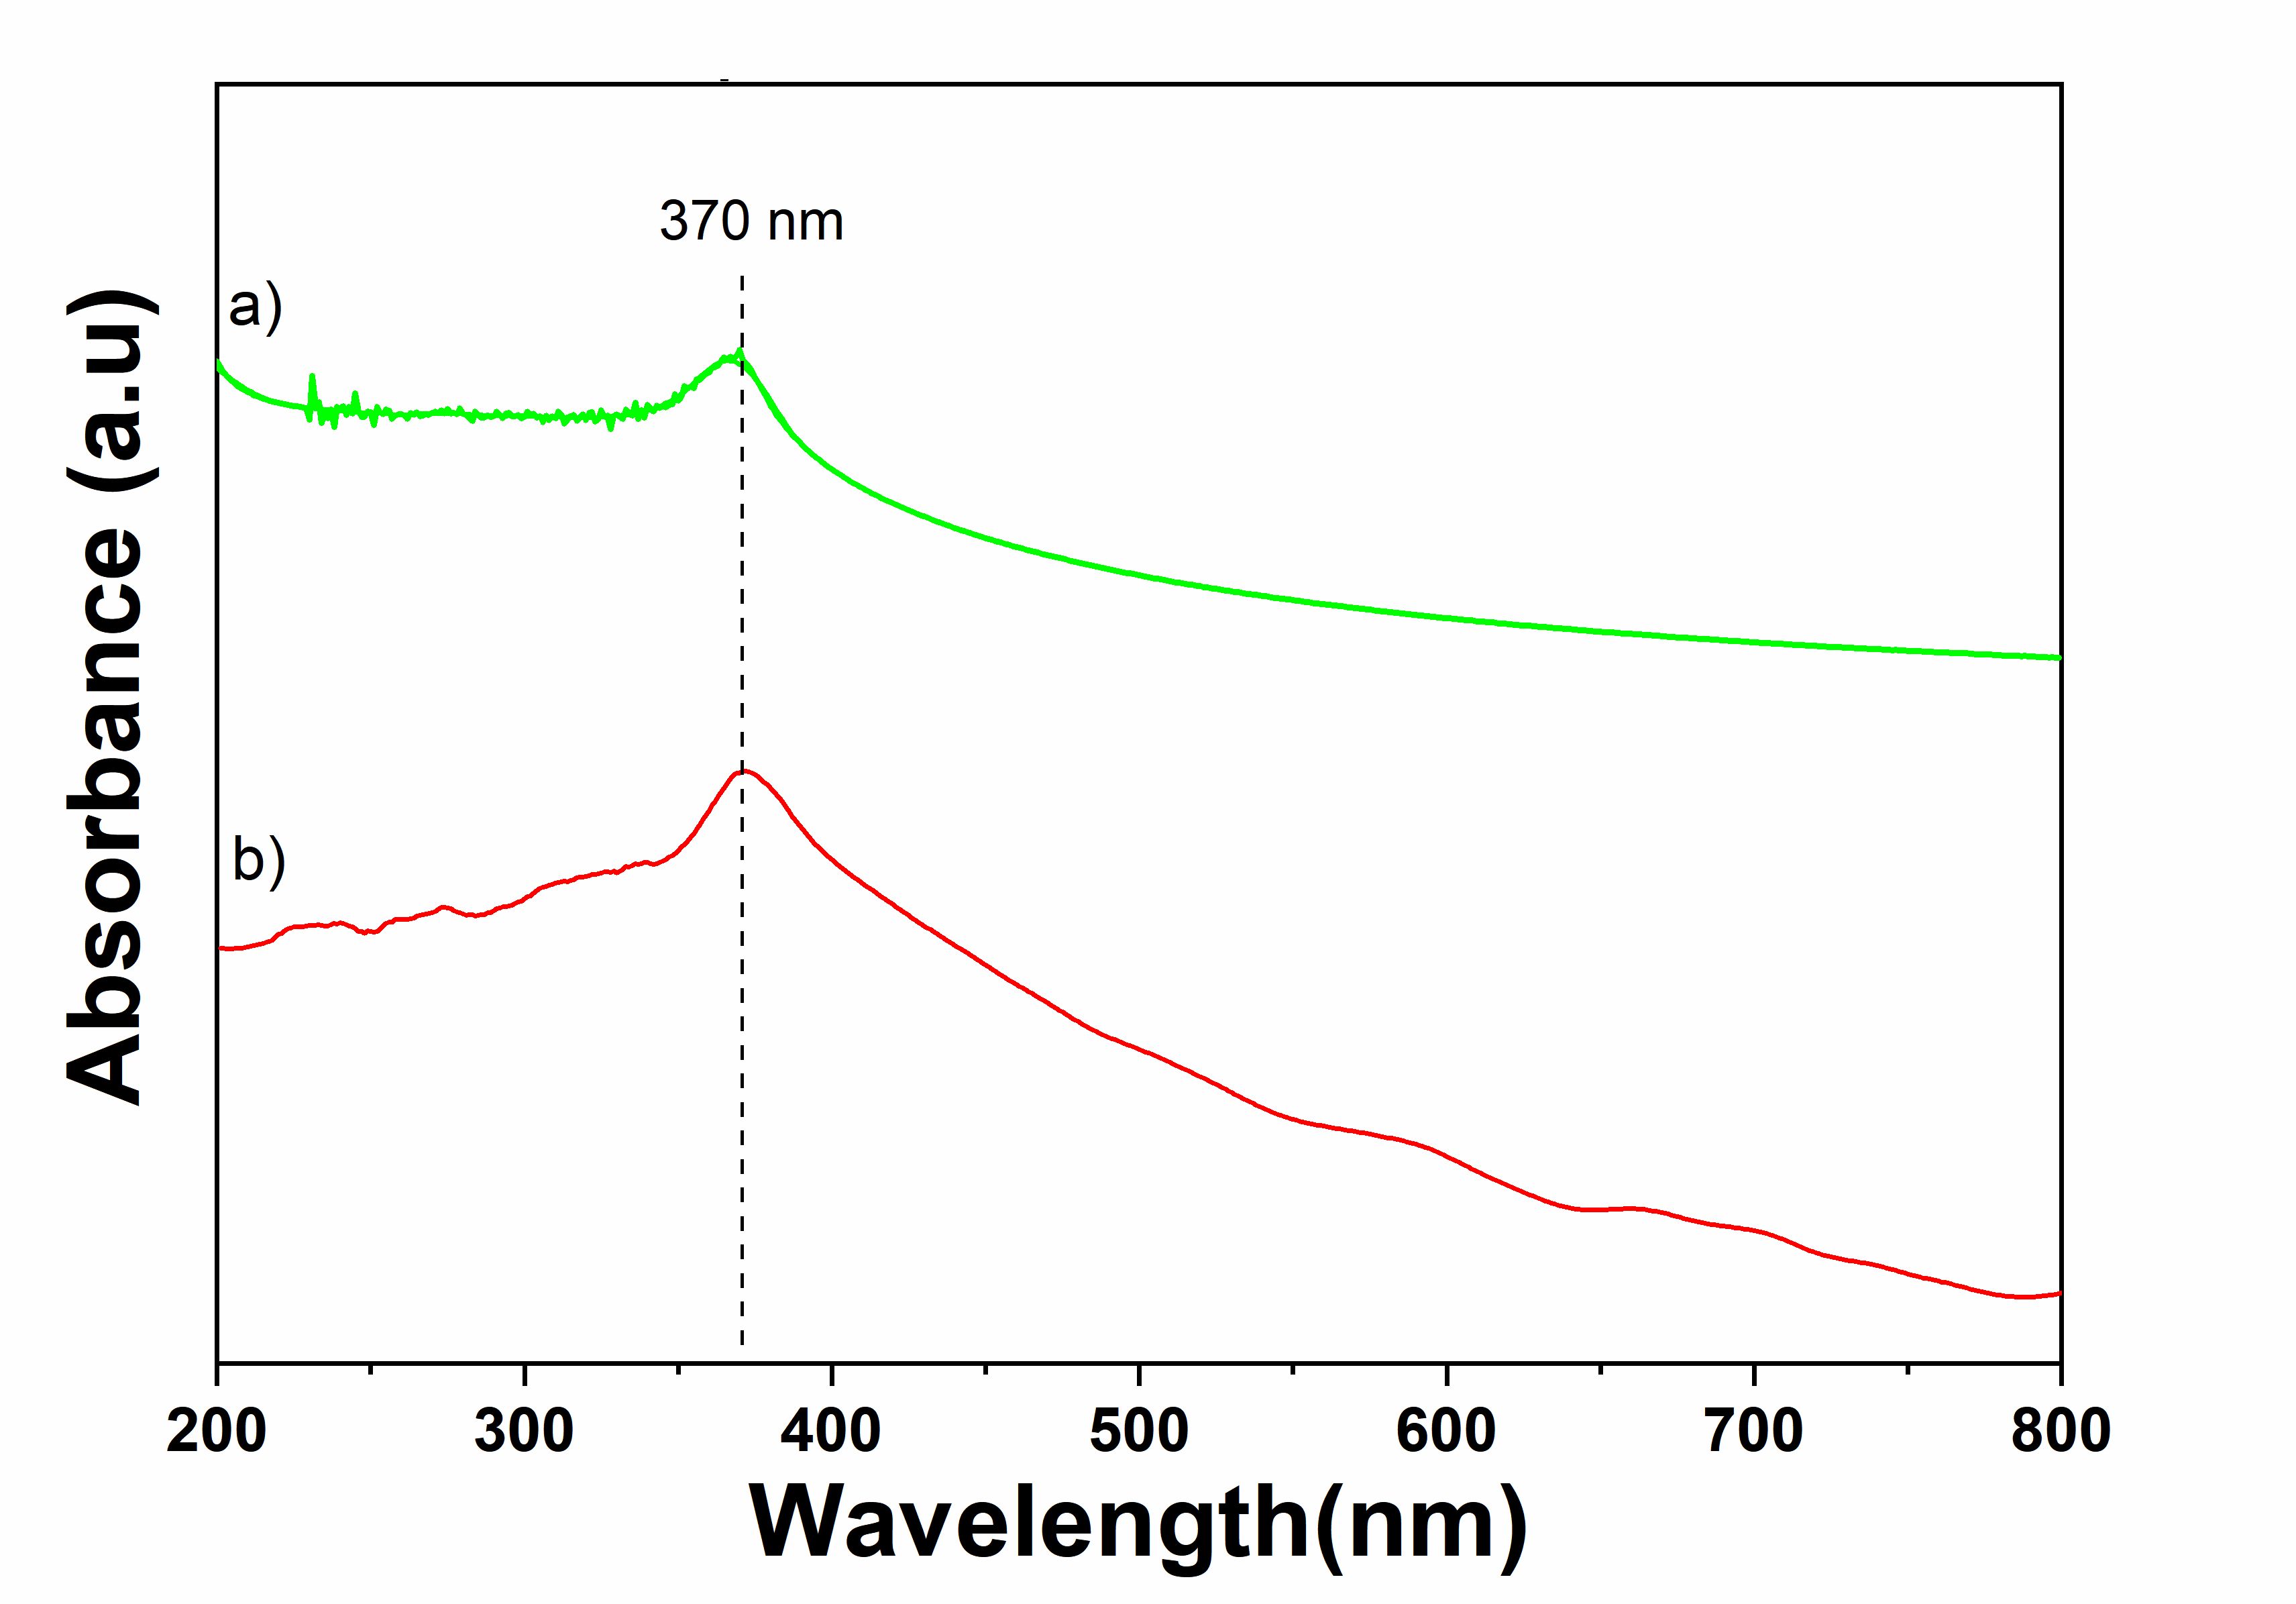
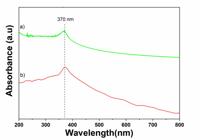
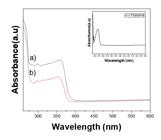
The prepared nanoparticles were confirmed through UV-Vis spectrum analysis. A colloidal dispersion was prepared by dispersing the nanoparticles in water, and the absorption spectrum was recorded using a UV-Vis spectrophotometer. Both ZnO and ZnO-ALE samples exhibited a characteristic absorption peak near 370 nm, attributed to the intrinsic band gap absorption of ZnO nanoparticles27 (Fig. 1). The UV-Vis spectra of the corresponding nanofibers are presented in Fig. 2, where (a) ZnO/PS and (b) ZnO-ALE/PS retain the 370 nm peak, confirming the presence of ZnO within the fibers. Additionally, both spectra show absorption bands at 260–270 nm, associated with π→π* electronic transitions of the aromatic rings in the PS matrix28.
3.2. Fourier Transform Infrared Spectra (FTIR)
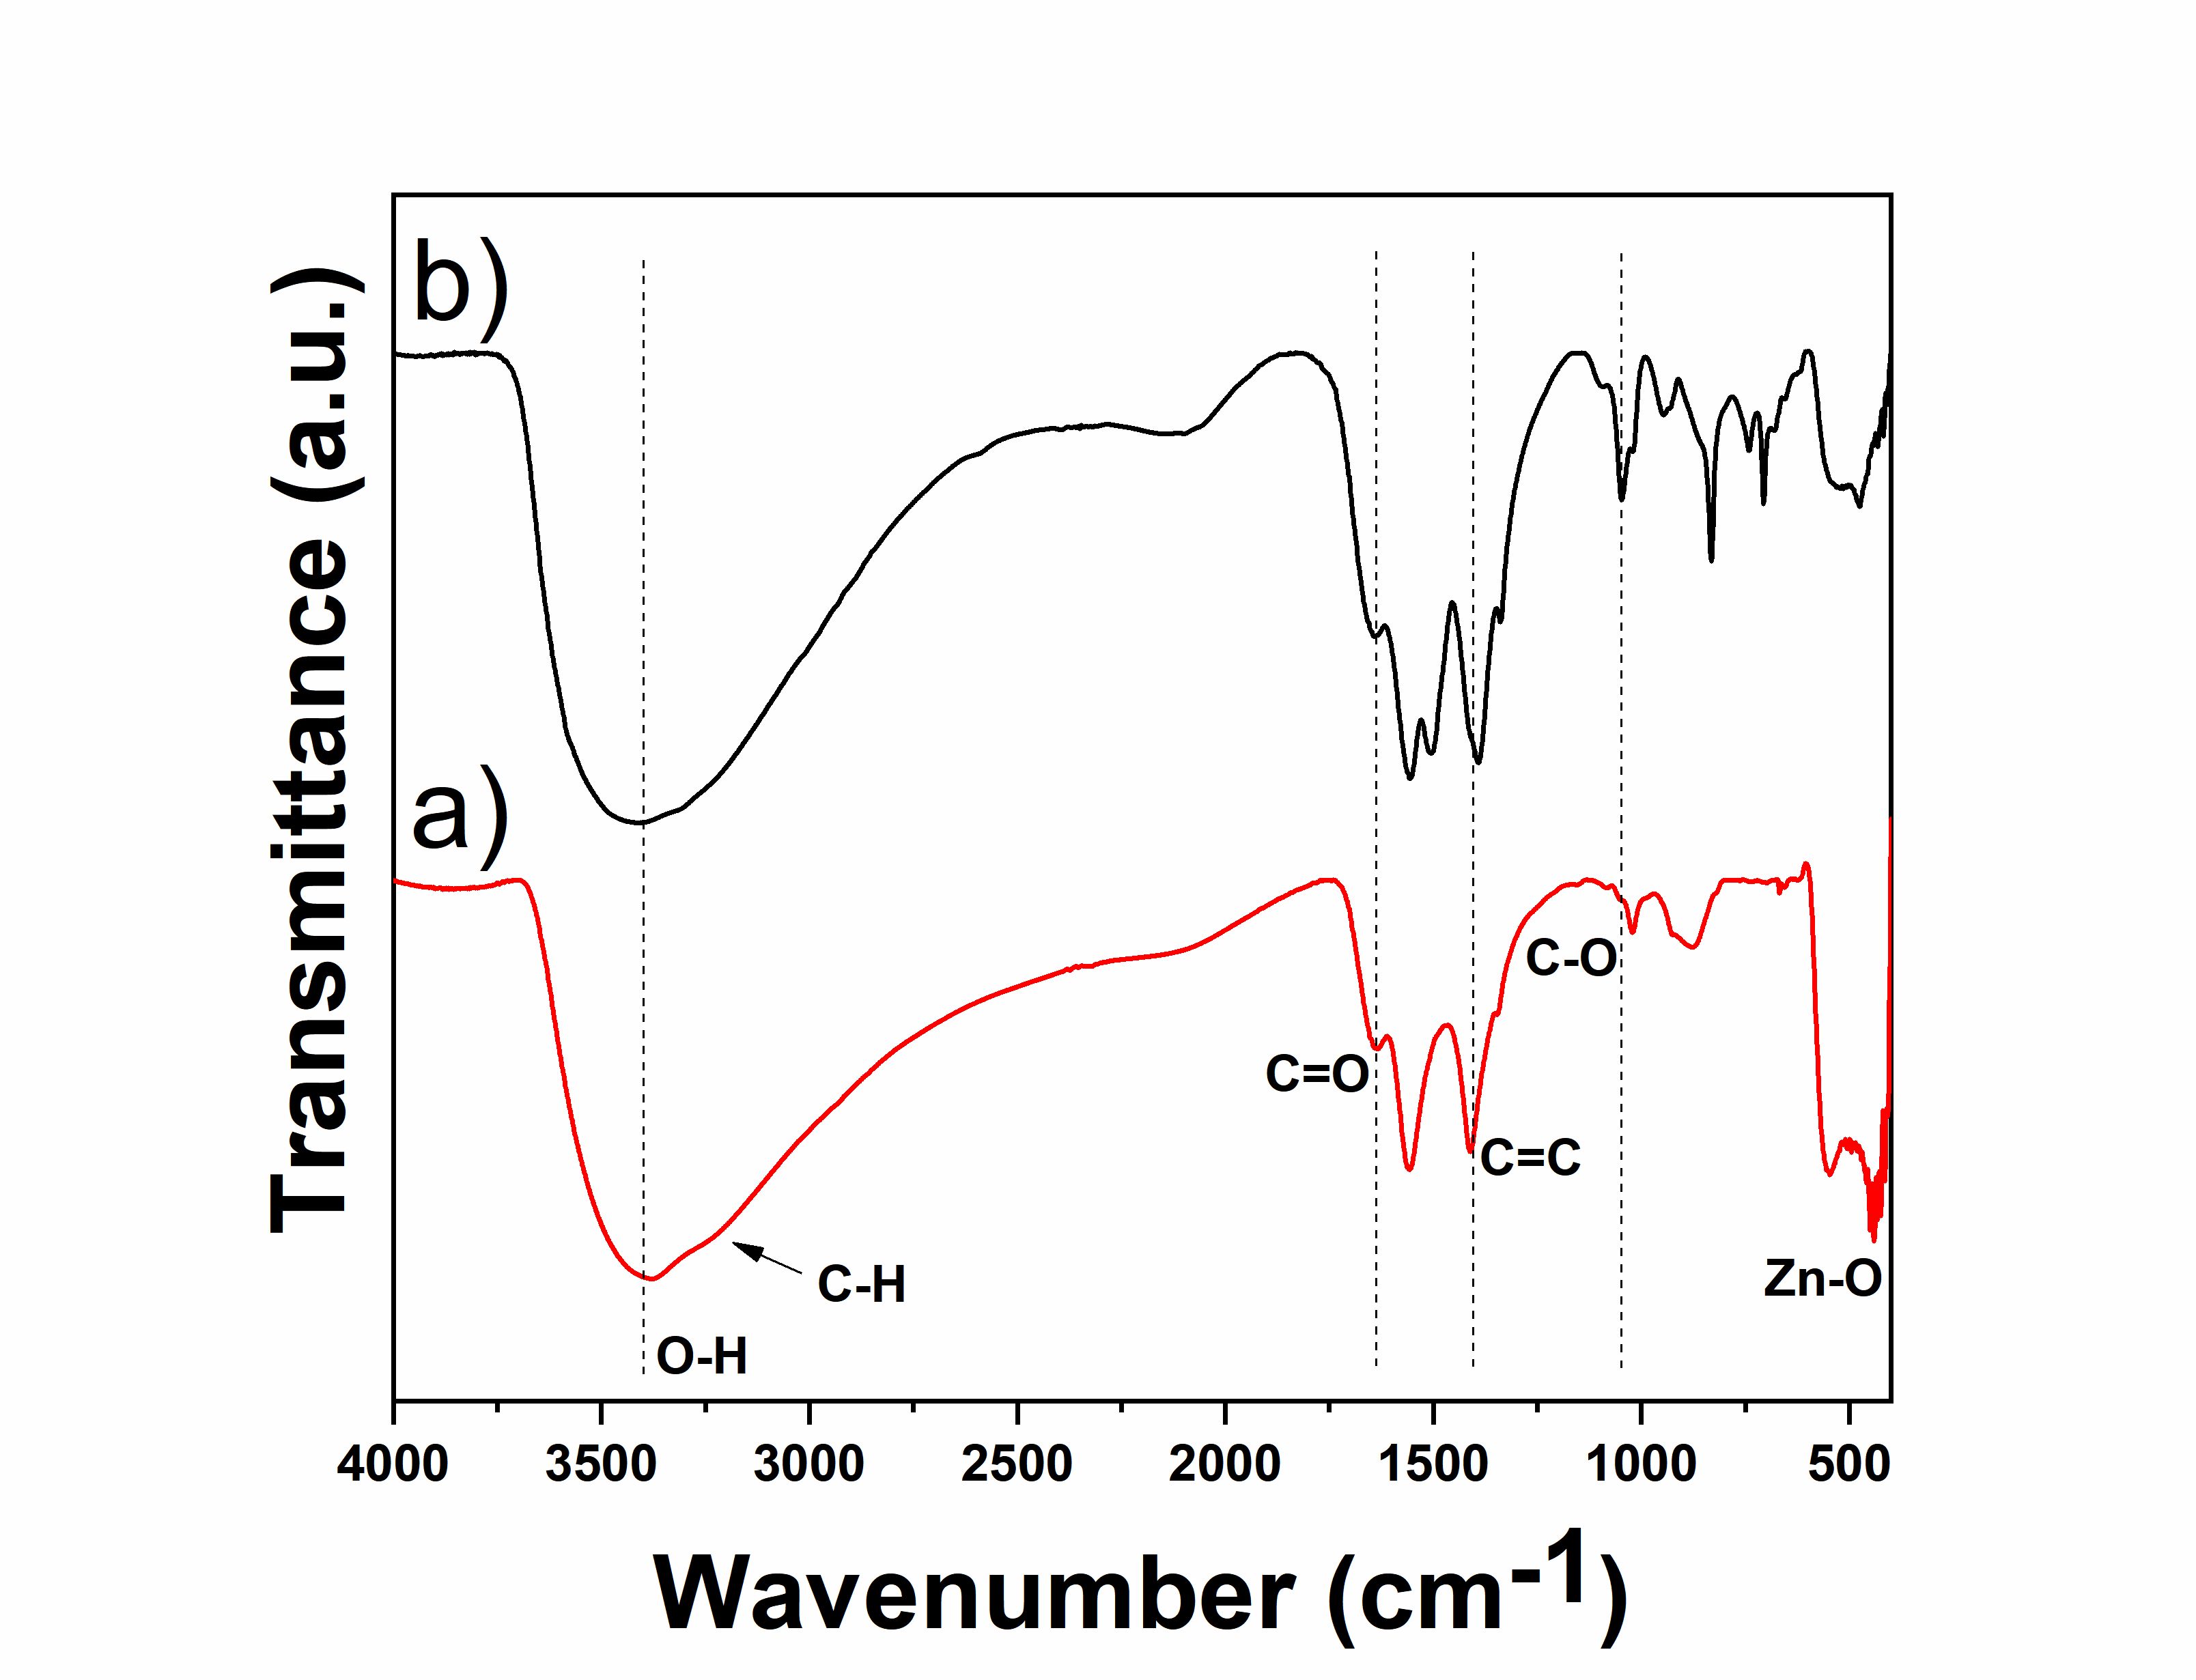
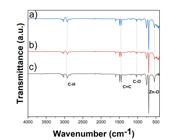
FTIR analysis was conducted to evaluate the chemical composition of the pure ZnO and ZnO-ALE nanoparticles. Both samples exhibited characteristic Zn–O vibrational bands in the 400–600 cm−1 range, confirming the formation of ZnO29. Additionally, a broad absorption band at 3437 cm−1 was observed, attributed to O–H stretching vibrations, likely originating from surface-adsorbed water or hydroxyl groups.
As shown in Fig. 3, the peaks observed between 400–600 cm−1 are characteristic of Zn–O vibrations, confirming successful ZnO synthesis29. The incorporation of ALE extract during synthesis is evidenced by peaks at 1555 cm−1 and 1640 cm−1, corresponding to C=C (aromatic rings) and C=O (flavonoid groups), respectively30. The broad band at 3410 cm−1 is attributed to O–H stretching vibrations, while a shift and asymmetry in this band, along with a peak at 2700 cm−1, suggest CH2 bonding. Additionally, the band at 1047 cm−1 corresponds to C–O asymmetric vibrations associated with β-glycosidic bonds in cellulose30. The absorption features between 1555–1640 cm−1 further indicate C=O stretching vibrations. Collectively, these FTIR results confirm the presence of various organic functional groups from the ALE extract – such as phenolic compounds and carboxylic acids – that act as reducing and stabilizing agents during ZnO nanoparticle formation.
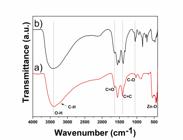
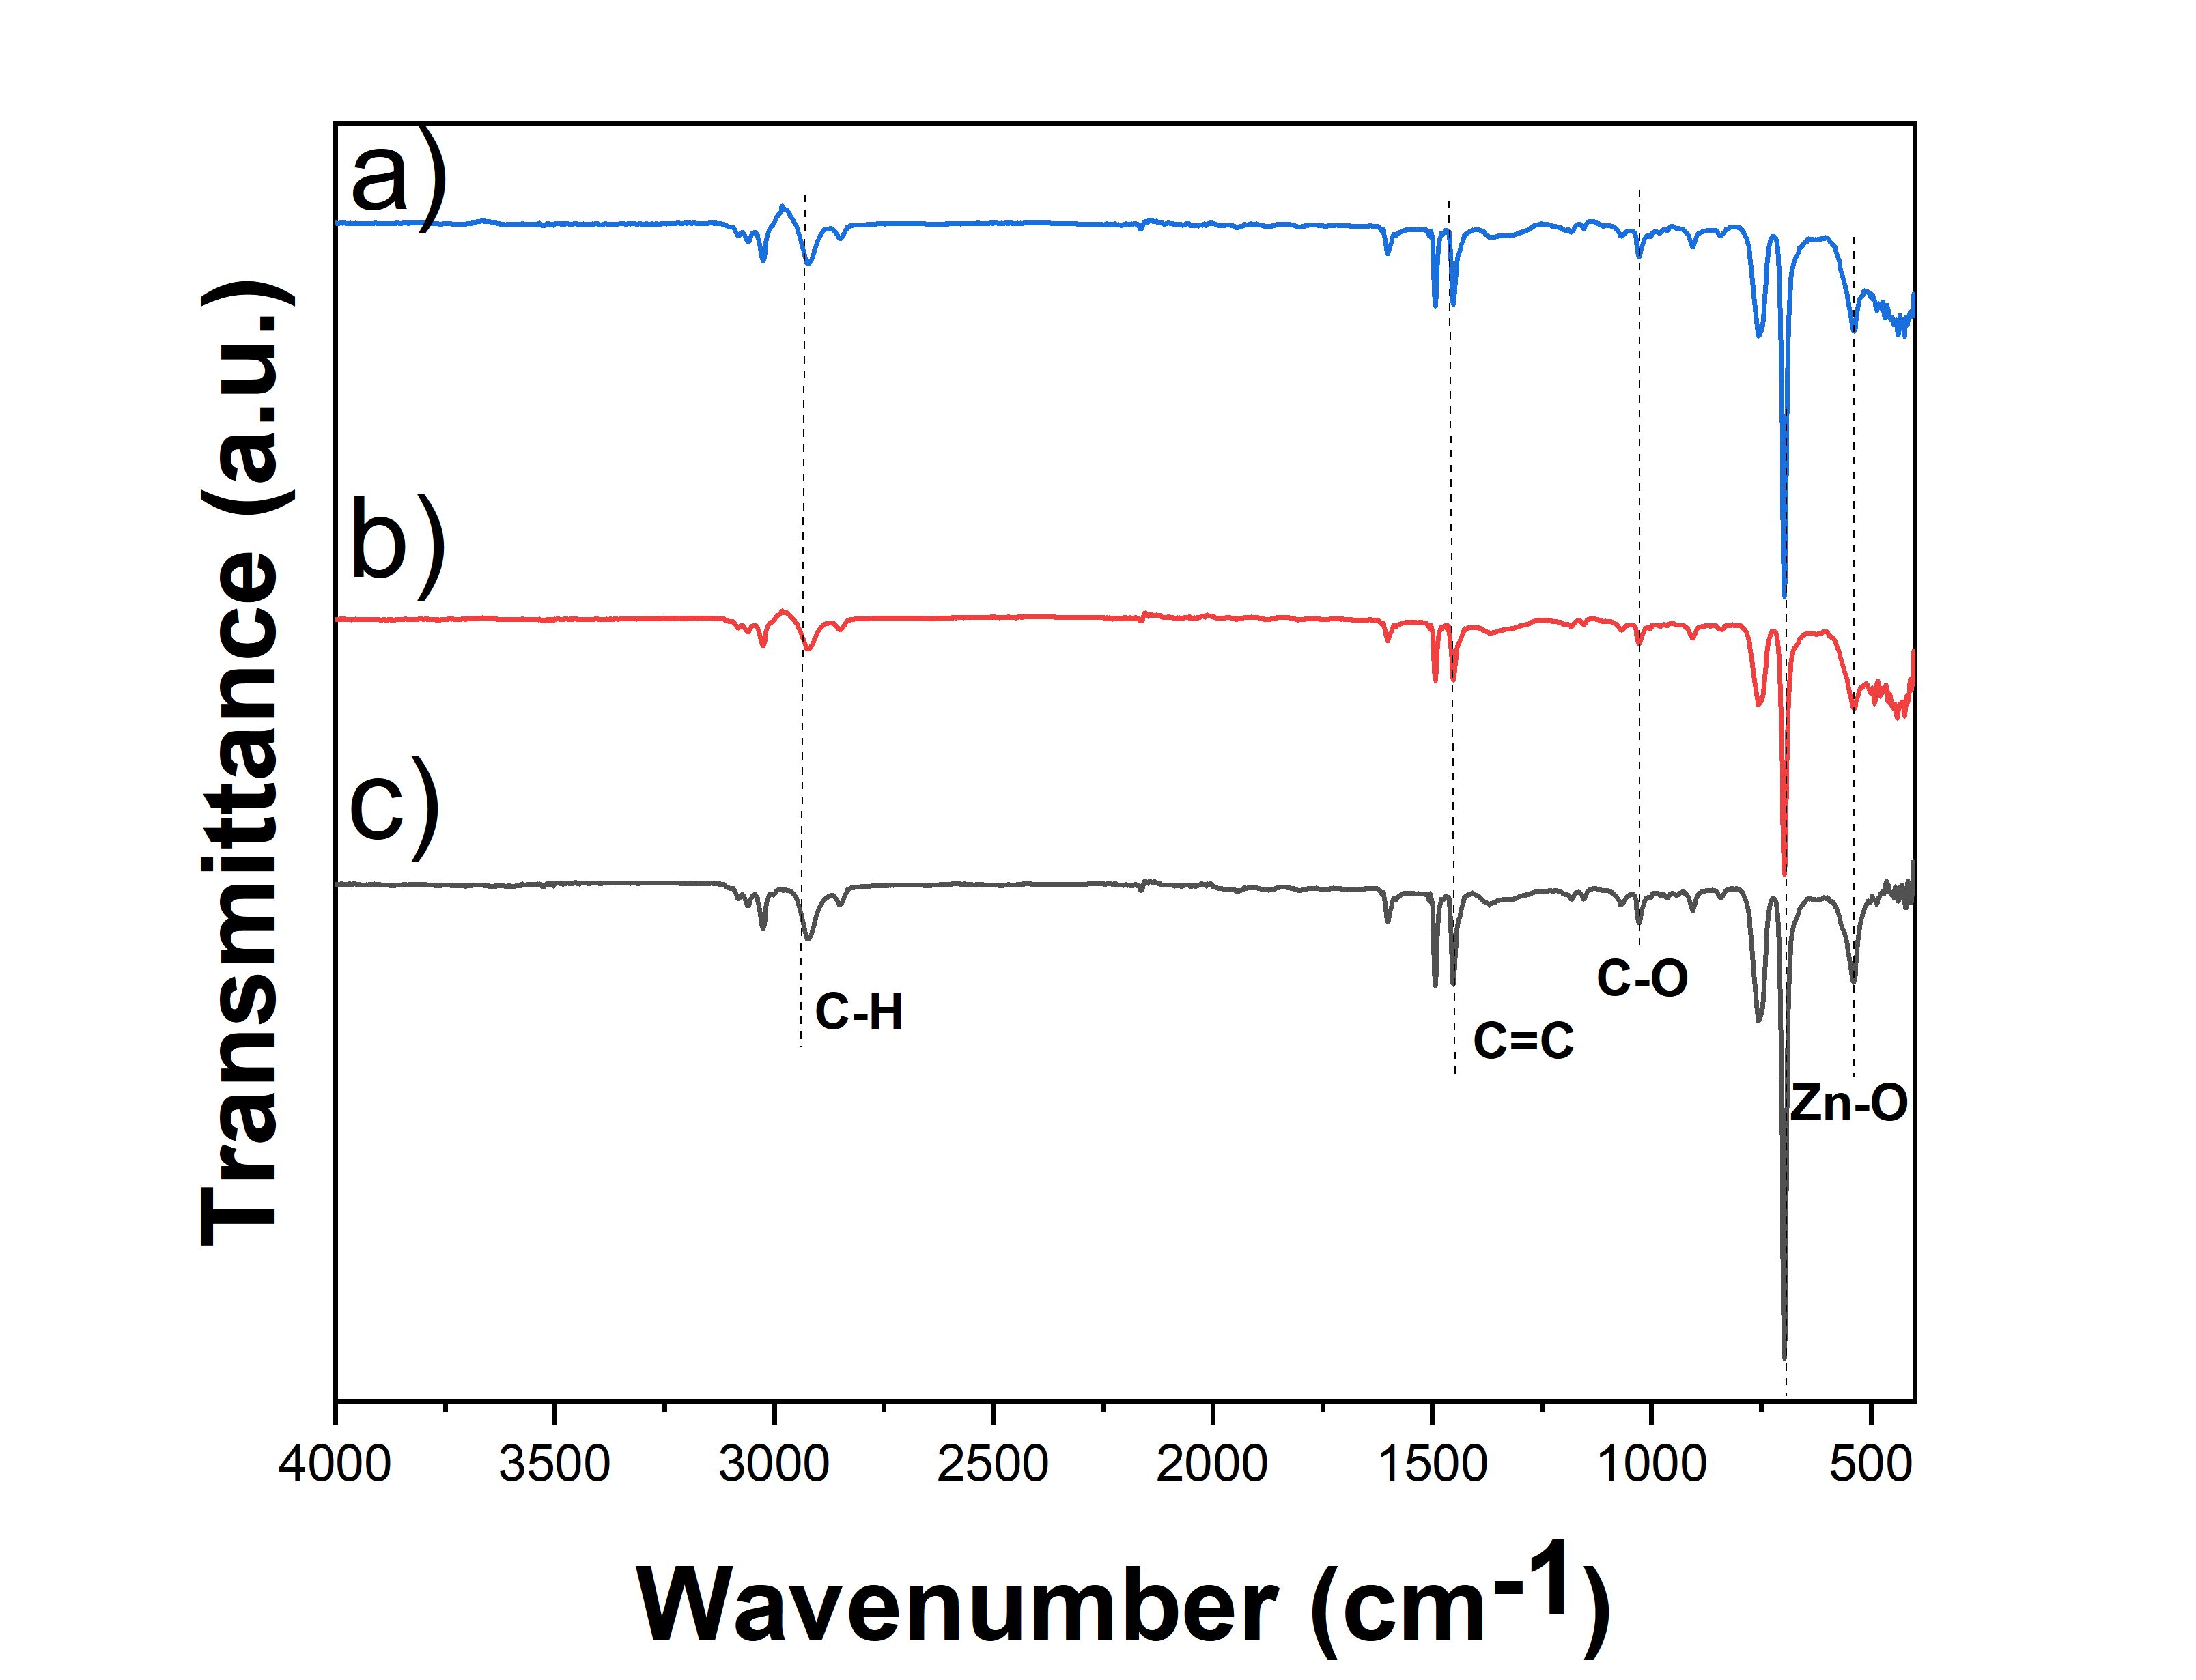
Fig. 4 presents the FTIR spectra of (a) pure PS, (b) PS/ZnO, and (c) PS/ZnO-ALE nanofibers. The characteristic absorption bands of PS are observed at approximately 3025 cm−1 (aromatic C–H stretching) and at 2920 cm−1 and 2850 cm−1 (aliphatic C–H stretching). Peaks at 1600 cm−1, 1490 cm−1, and 1450 cm−1 correspond to C=C stretching vibrations of the aromatic rings, while the band at 700 cm−1 is associated with out-of-plane bending of the benzene ring. In both PS/ZnO and PS/ZnO-ALE samples, distinct bands between 400 and 600 cm−1 are evident, confirming the presence of Zn–O vibrations and indicating that the ZnO nanoparticles remain stable and well-dispersed within the polymer matrix.
3.3. X-Ray Diffraction (XRD)
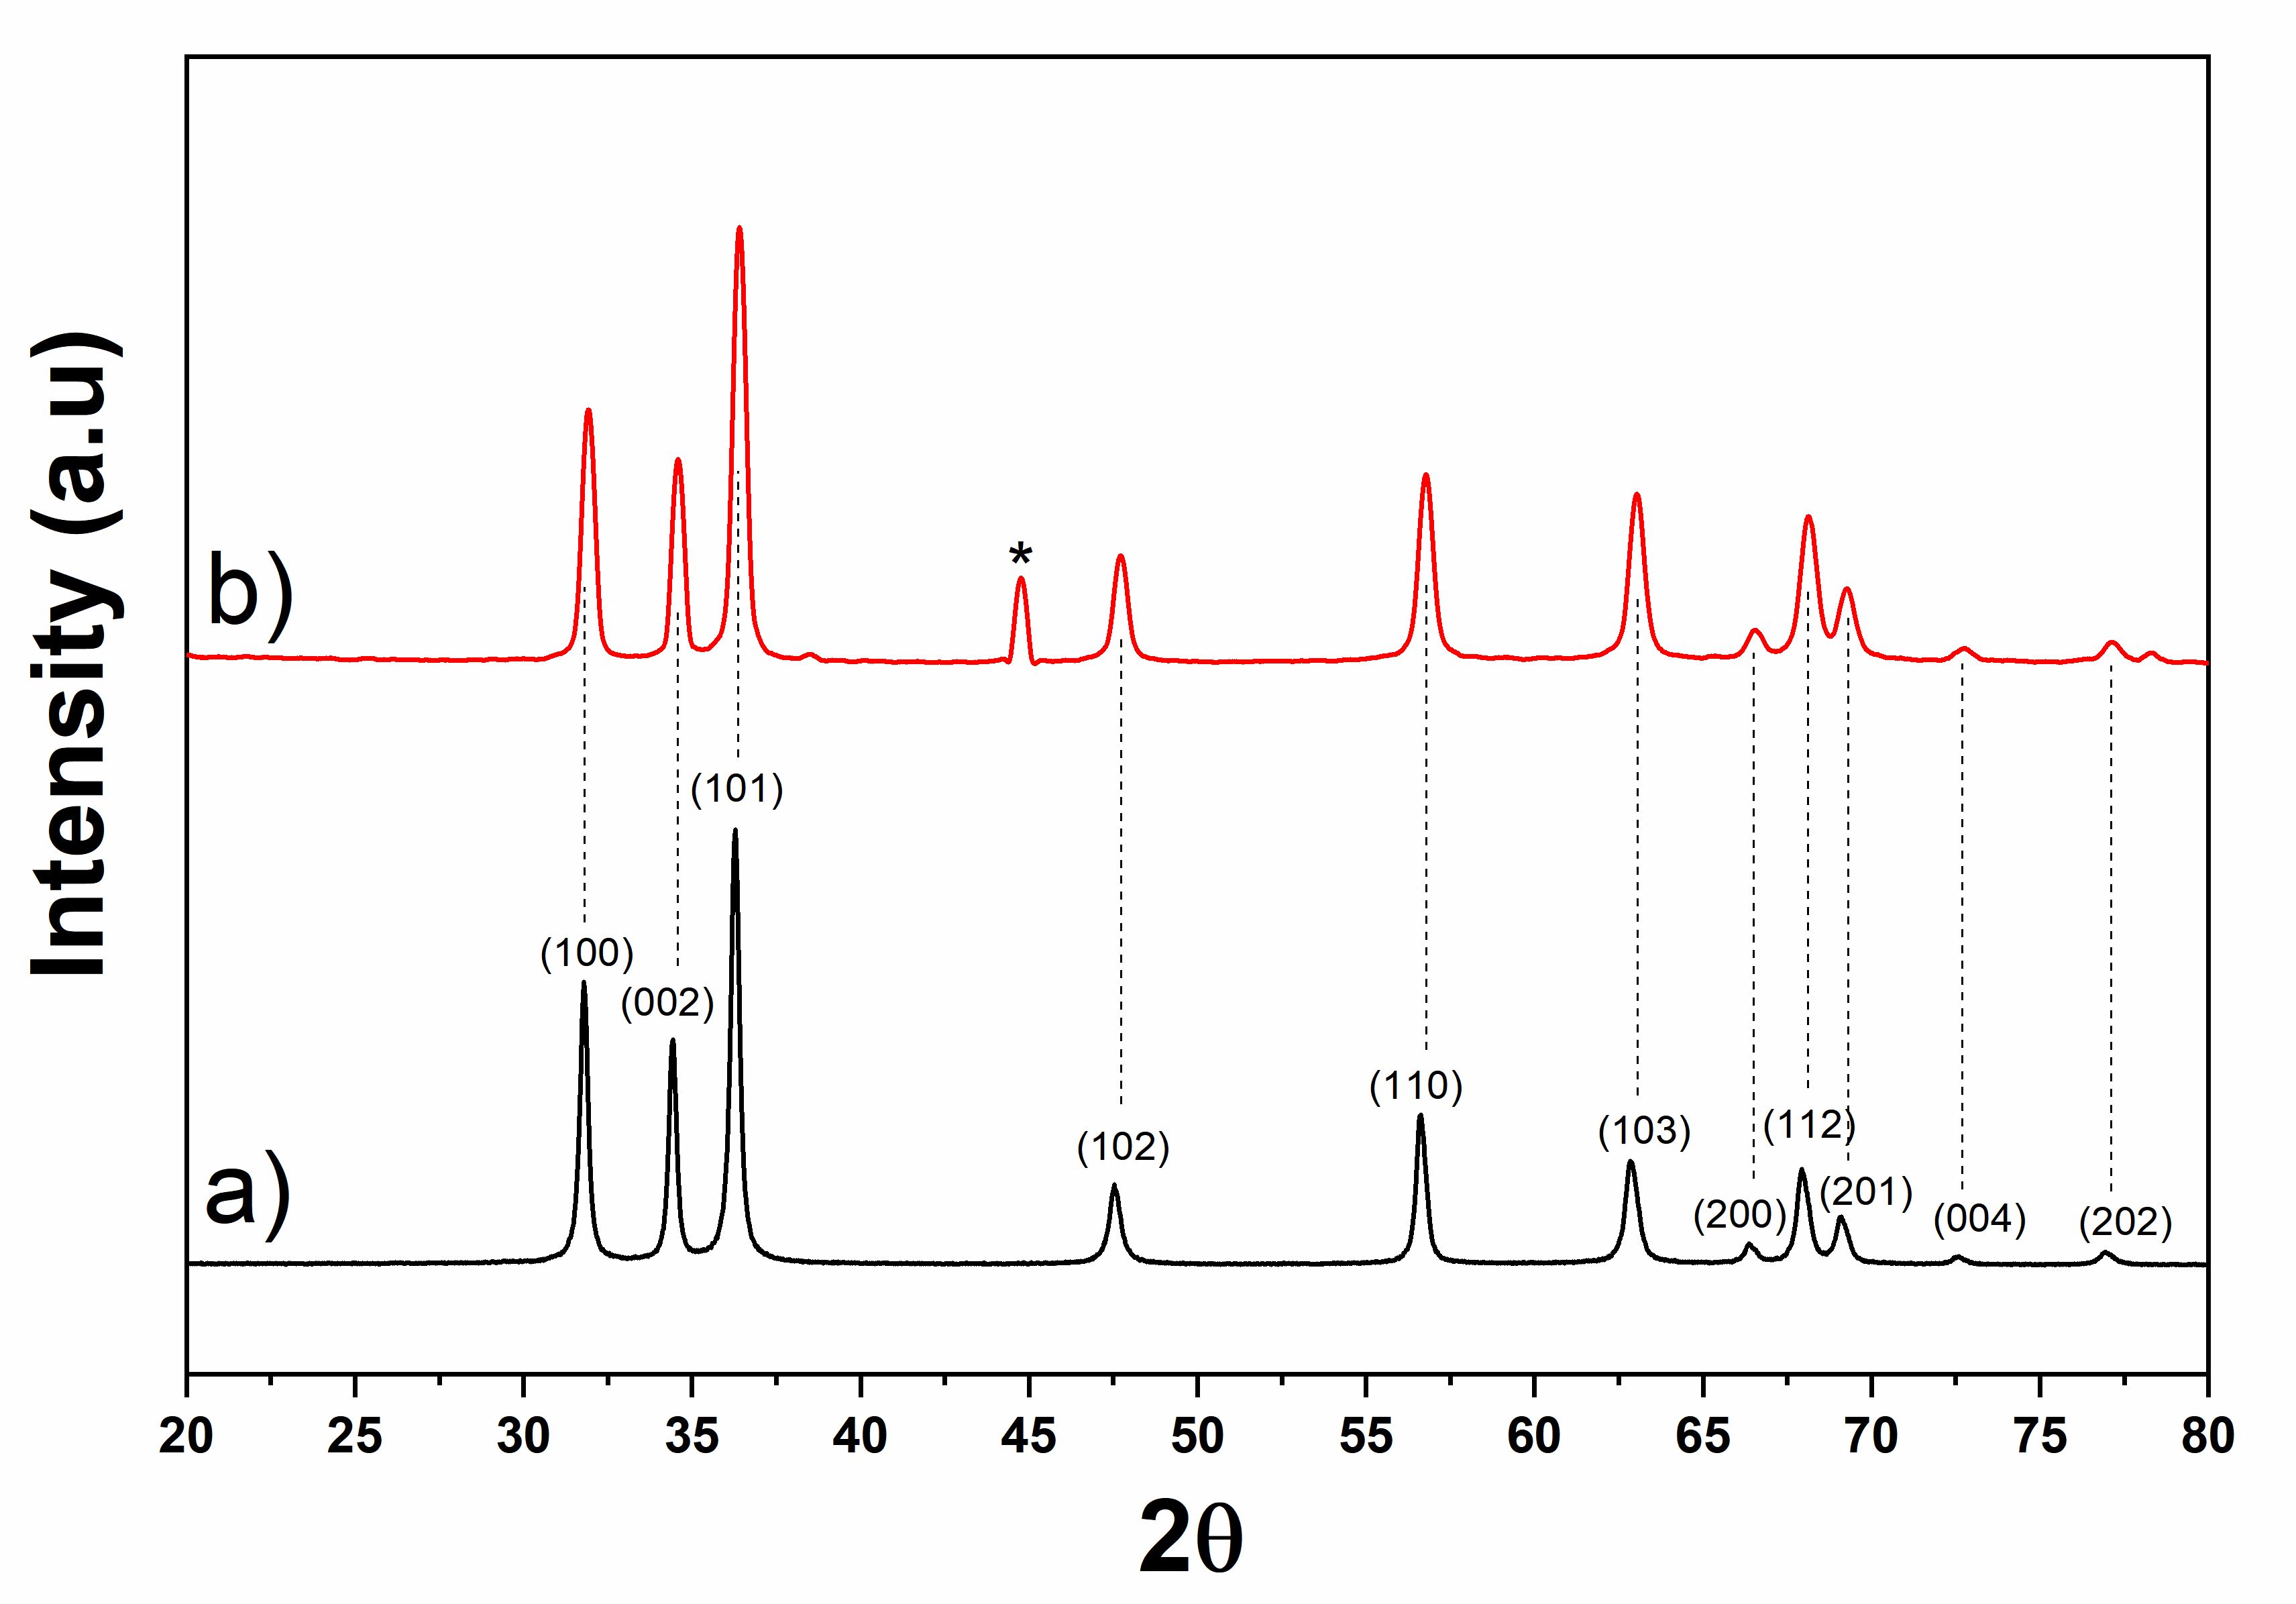
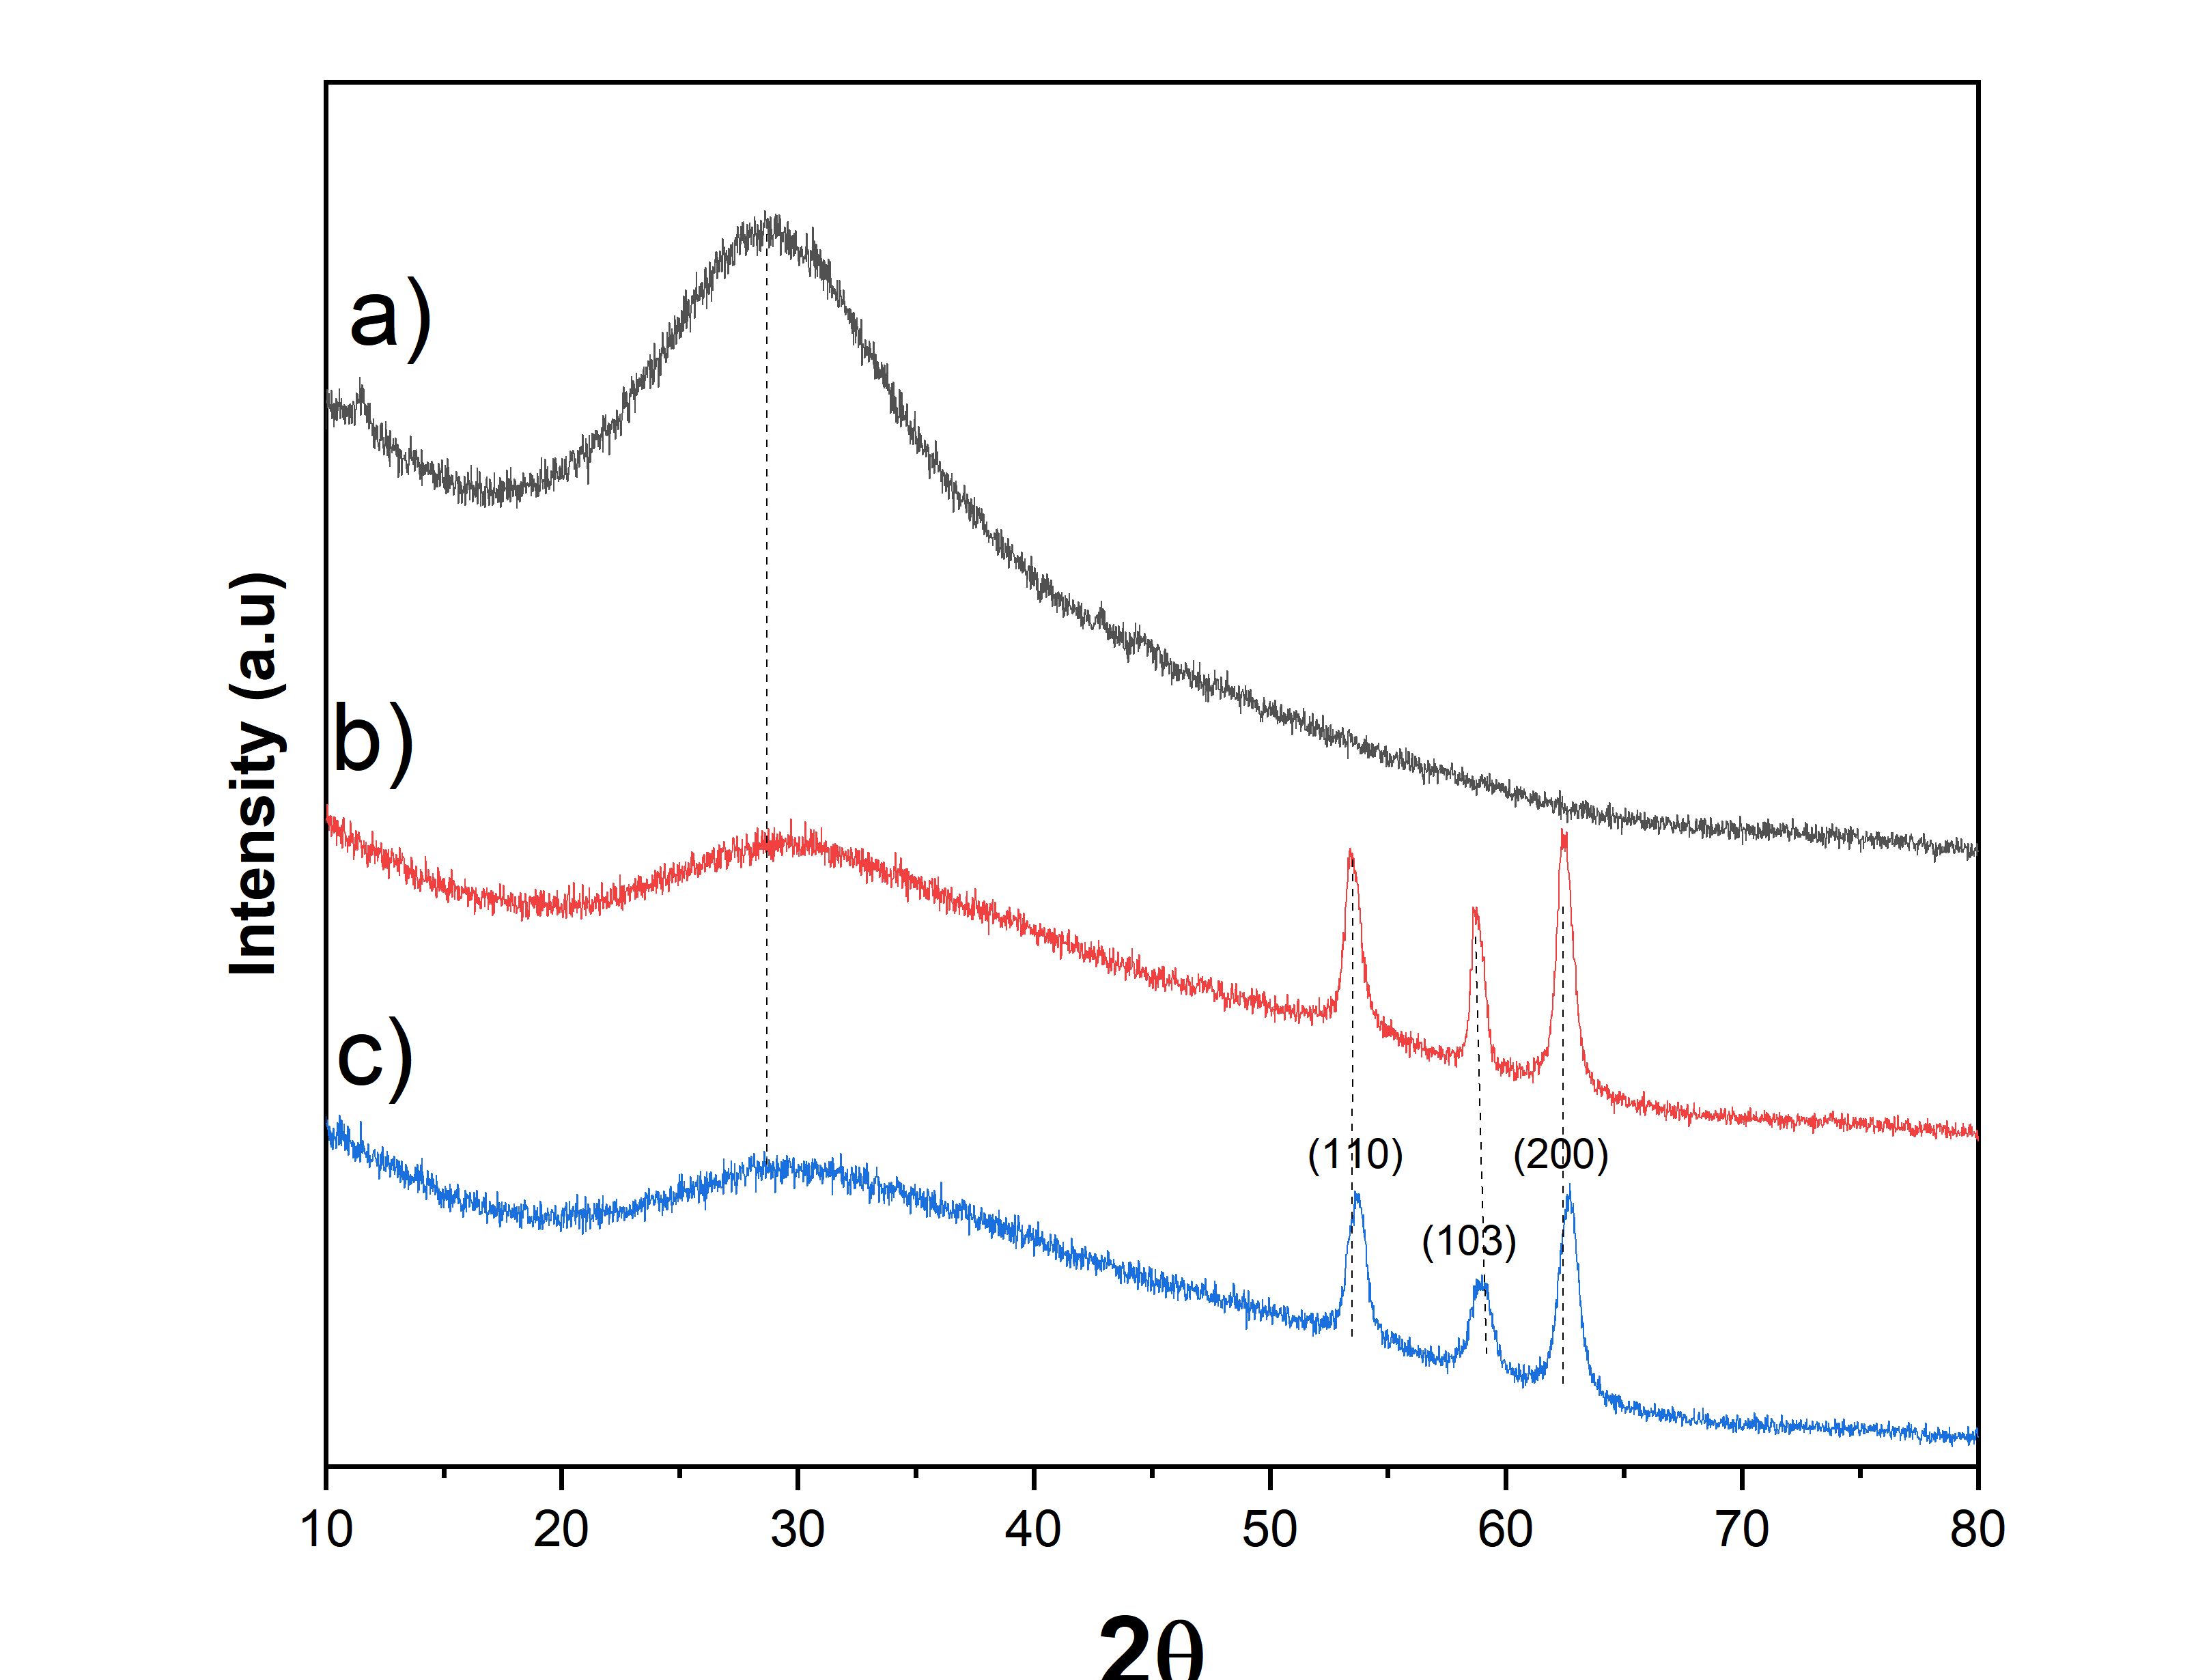
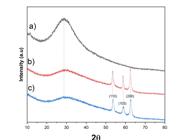
The X-ray Diffraction (XRD) patterns of ZnO and ZnO-ALE nanoparticles are shown in Fig. 5. The XRD patterns of the nanoparticles revealed the crystalline nature of ZnO, displaying well-defined and intense diffraction peaks. These peaks correspond to the reflection planes (100), (002), (101), (102), (110), (103), (200), (004), and (202). In addition, the XRD curve of ZnO-ALE exhibits one diffraction peak at 2θ ≈ 44, corresponding to the ALE31. By comparing the angular positions of these peaks with the data in the JCPDS file No. 01-076-0704, the results confirmed that the synthesized ZnO has a hexagonal crystal structure. Fig. 6 shows the XRD patterns of the PS-based fibers. Pure PS exhibits a broad diffraction band between 20° and 35°, characteristic of its amorphous nature. In the PS/ZnO and PS/ZnO-ALE fibers, this amorphous feature remains dominant; however, additional diffraction peaks corresponding to the (110), (103), and (200) planes of ZnO are also observed. These peaks confirm that the crystalline structure of ZnO was retained within the polymer matrix32.
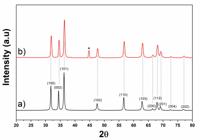
The average diameter of the ZnO and ZnO-ALE nanoparticles was estimated using the Scherrer equation, focusing on the most intense (101) diffraction peak. Pure ZnO exhibited a full width at half maximum (FWHM) of 0.31819, corresponding to an average crystallite size of 27.7 nm. In contrast, ZnO synthesized with ALE extract (ZnO-ALE) showed a slightly higher FWHM (0.36039), yielding a smaller crystallite size of 24.6 nm. This increase in FWHM and the corresponding reduction in crystallite size are likely related to the presence of phytochemicals in the extract, which can act as complexing agents or growth inhibitors during nucleation. Such interference in crystal growth is consistent with previous reports33, where natural extracts led to the formation of smaller particles with increased structural disorder. Additionally, the observed peak broadening may reflect internal stresses or a higher density of structural defects, commonly reported in materials synthesized via green routes.
3.4. Morphological analysis of ZnO, ZnO-ALE, ZnO/PS and ZnO-ALE/PS nanofilters
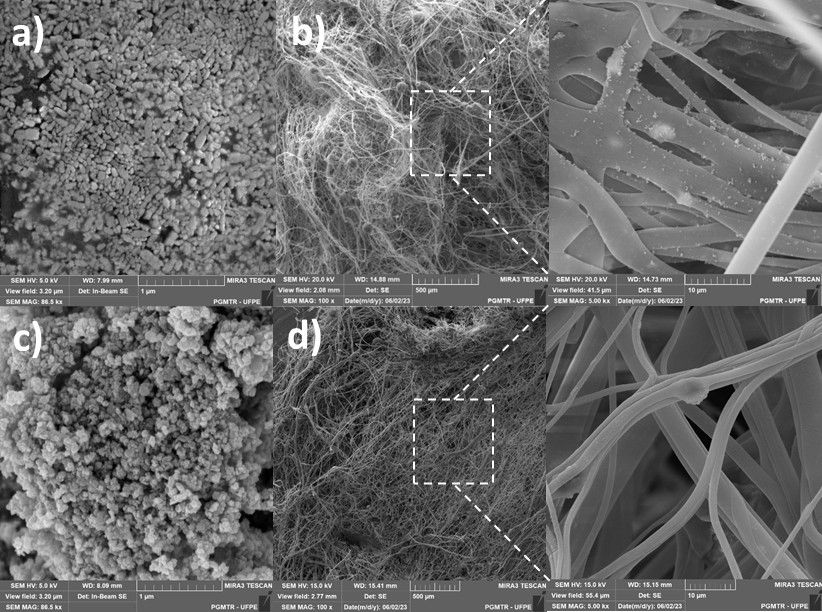
Fig. 7 shows the SEM images of ZnO, ZnO-ALE, ZnO/PS, and ZnO-ALE/PS nanofilters. As seen in Figure 7c, synthesis with ALE allows the production of smaller particles with an almost spherical shape. By incorporating ZnO nanoparticles into a 15% (w/w) PS suspension in dimethylformamide (DMF) and processing the mixture via electrospinning, nanocomposites in the form of fibers were successfully produced. These fibers consist of a PS matrix with ZnO nanoparticles uniformly dispersed throughout. As illustrated in Fig. 7b e Fig. 7d, SEM images of ZnO/PS and ZnO-ALE/PS nanofilters display a well-defined matrix composed of fine PS fibers.
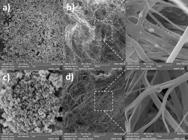
Both nanofilters exhibit a similar structure, with their morphology consisting of small ZnO crystal clusters, as shown in Fig. 7b. However, the fibers containing ALE demonstrate better dispersion of nanoparticles within the nanofibers. This is evident in Fig. 7b, where the fiber surfaces appear smooth, compared to Fig. 7d, where the nanofibers show visible nanoparticle aggregation on the surface, indicating incomplete dispersion. These results highlight that incorporating ALE into the fibers improves nanoparticle dispersion, leading to smoother nanofiber surfaces.
The initial electrospun fibers displayed a smooth, regular, and straight surface, similar to nanofibers made of pure PS. However, as the ZnO nanoparticles concentration increased to 30%, small granules began to appear on the surface of the nanofiber mats. At higher ZnO concentrations, these granules became more prominent due to nanoparticle aggregation in the more concentrated polymer suspension.
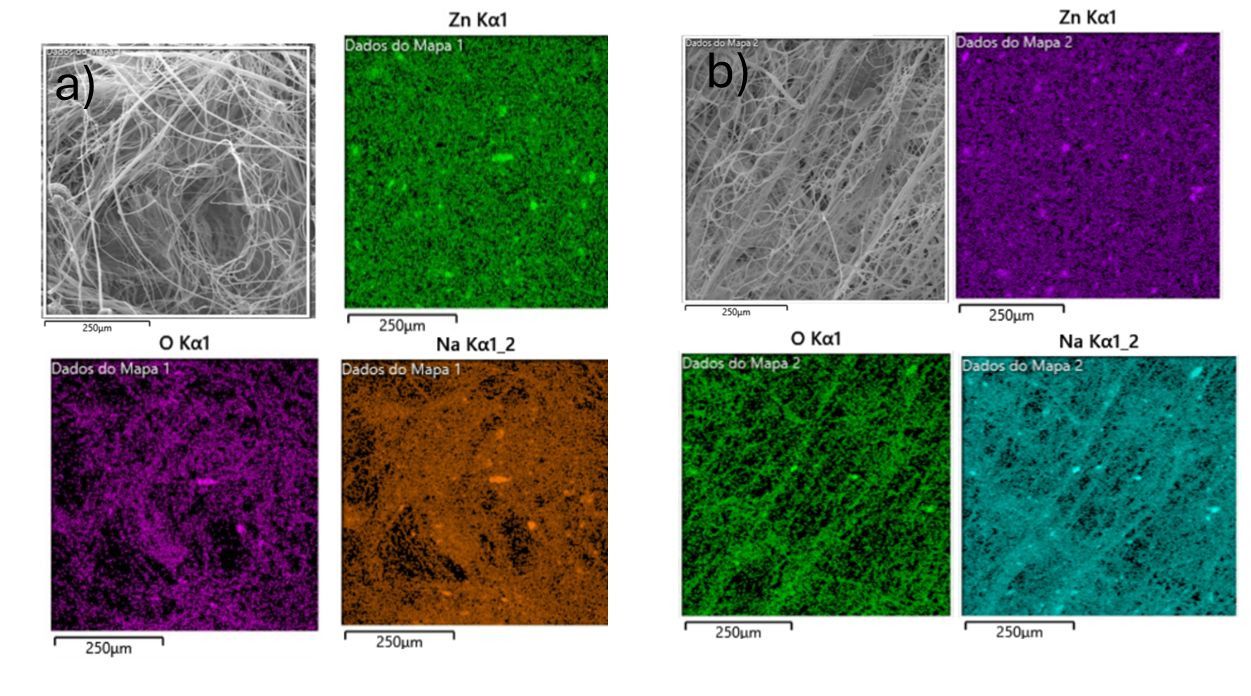
Energy-dispersive spectroscopy (EDS) was conducted to determine the elemental composition of the samples. The spectra for both ZnO/PS and ZnO-ALE/PS nanofilters confirmed the presence of carbon (C), zinc (Zn), oxygen (O), and sodium (Na). The oxygen signal primarily originates from ZnO and residual sodium hydroxide (NaOH) used during synthesis. Fig. 8 presents the EDS results for the nanofiber samples. In Figure 8a, the SEM image shows the surface morphology of the ZnO/PS nanofilter, followed by elemental maps for Zn, O, and Na. The widespread distribution of zinc across the matrix confirms the successful incorporation and uniform dispersion of ZnO nanoparticles within the polymeric structure.
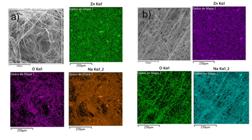
EDS maps of (a) ZnO/PS and (b) ZnO-ALE/PS: zinc (Zn) in green, oxygen (O) in purple, and sodium (Na) in orange.
Similarly, the elemental mapping of the ZnO-ALE/PS sample (Fig. 8b) reveals a homogeneous distribution of Zn, O, and Na within the polymeric matrix. These results suggest that the use of ALE extract during synthesis enhances the uniform dispersion of nanoparticles in the PS nanofibers.
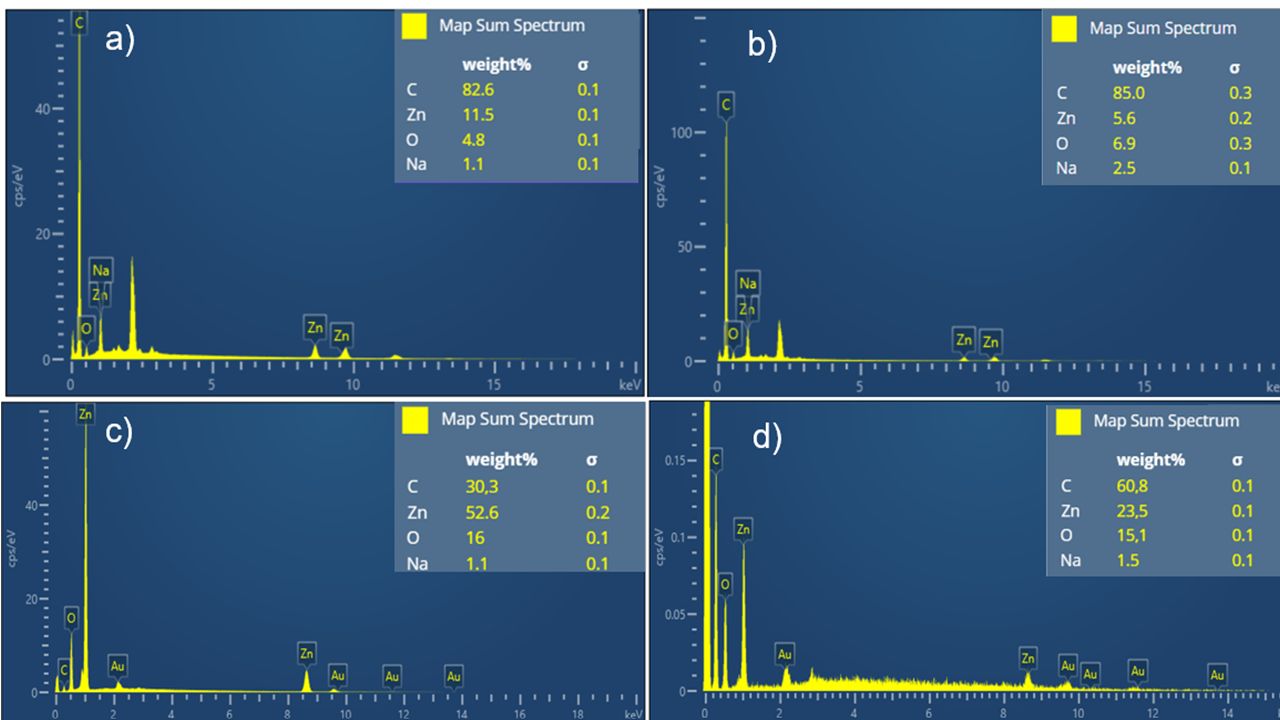
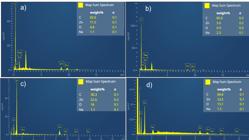
Further EDS mapping was conducted on the isolated ZnO and ZnO-ALE nanoparticles (Fig. 9), confirming Zn, O, Na, and C as the predominant elements, consistent with the expected composition of the nanomaterials. Additionally, peaks corresponding to gold (Au) and palladium (Pd) were detected in the EDS spectra of both nanoparticle samples. These elements originate from the sputter-coating process used to render the samples electrically conductive for SEM analysis and are not intrinsic to the synthesized materials.
3.5. Photodegradation test of ZnO and ZnO-ALE nanoparticles
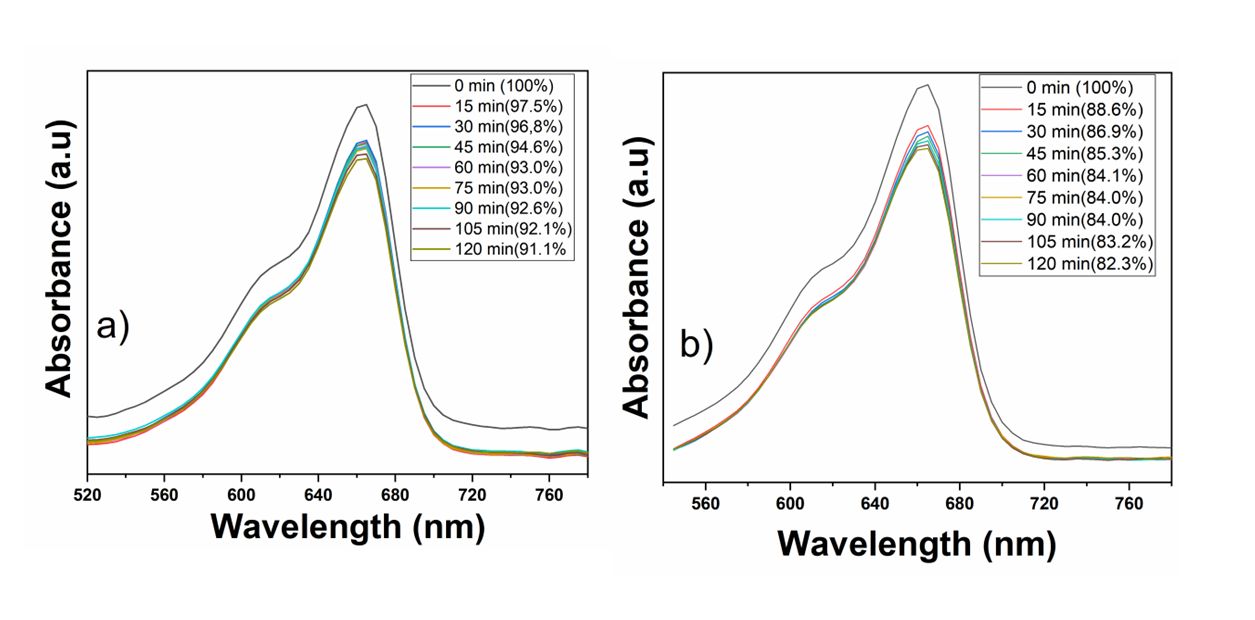
The photodegradation effects were highly pronounced when the MB solution was exposed to ultraviolet irradiation in the presence of the catalysts, as illustrated in Fig. 10. The figure displays spectra recorded at 15-minute intervals during the exposure of the dye to ZnO and ZnO-ALE catalysts under UV radiation at 254 nm.
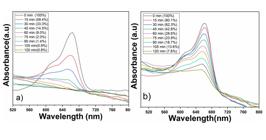
The results clearly indicate that the degradation rate increased progressively with each measurement, demonstrating the consistent effectiveness of ZnO and ZnO-ALE as photocatalysts over time. A notable visual reduction in the intensity of the blue color in the MB solution was observed, with the solution becoming nearly colorless after 120 minutes of exposure to UV-C radiation when using pure ZnO, as shown in Fig. 10(a). In contrast, when ZnO-ALE was used under identical conditions, the MB solution did not reach the same level of clarity, as depicted in Fig. 10(b).
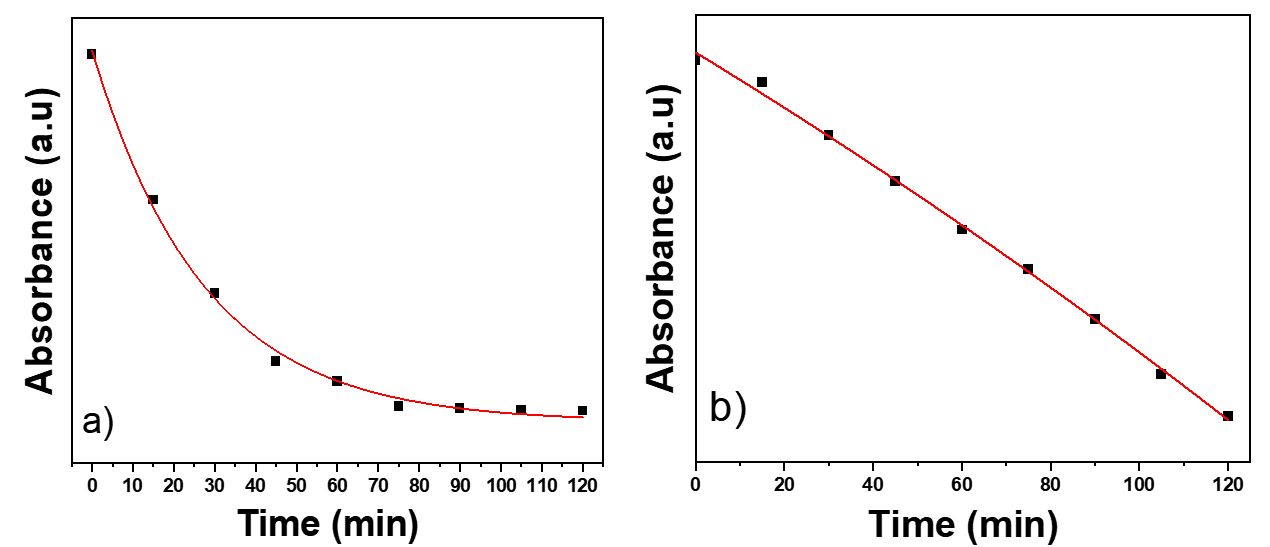
The results illustrated in the figures above indicate that pure ZnO is the most effective catalyst. However, since we are dealing with catalysts, a kinetic evaluation of the degradation was performed. For this, kinetic graphs were constructed, where the exponential curves were calculated and the values of 𝑅0 for each degradation process were determined (Fig. 11). The higher the modulus of 𝑅0, the better the material's performance, since this value represents the decay factor in the fitting equation (Equation 2).
In the equation, ABS is the absorbance height (h) in absorbance units, t is the time in minutes, 𝑅0 is the exponential decay factor, and A is the factor when t → 0.
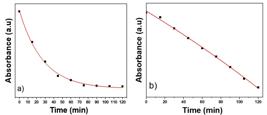
Thus, it can be concluded that pure ZnO nanoparticles exhibited the most promising performance in photocatalytic degradation of MB, followed by ZnO-ALE. Additionally, the absorption measurements displayed a non-linear trend, which may be attributed to the formation of intermediates that absorb light in the same spectral region.
The observed photocatalytic behavior is attributed to the fundamental charge transfer mechanisms governing ZnO activity. Under UV irradiation, ZnO nanoparticles generate electron-hole pairs (e−/h+) as electrons are excited from the valence band to the conduction band, leaving behind positively charged holes. These charge carriers participate in surface redox reactions, producing reactive oxygen species (ROS) such as hydroxyl radicals (•OH) and superoxide anions (O2−•)34. These ROS exhibit strong oxidative potential, promoting the degradation of organic pollutants like MB into smaller, less harmful molecules. Although ZnO-ALE nanoparticles also demonstrated photocatalytic activity, their efficiency was slightly lower than that of pure ZnO, likely due to the larger specific surface area of the latter34.
3.6. Photodegradation test with ZnO/PS and ZnO-ALE/PS nanofilters
For the MB decontamination tests using ZnO/PS and ZnO@ALE/PS nanofilters, significant photodegradation effects were observed. The nanofilters were directly immersed in the solution and acted as catalysts. Fig. 12 shows spectra recorded at 15-minute intervals during the dye's exposure to the two types of nanofilters (ZnO/PS and ZnO-ALE/PS) under UV radiation at 254 nm.
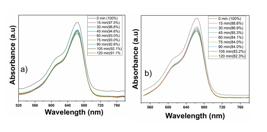
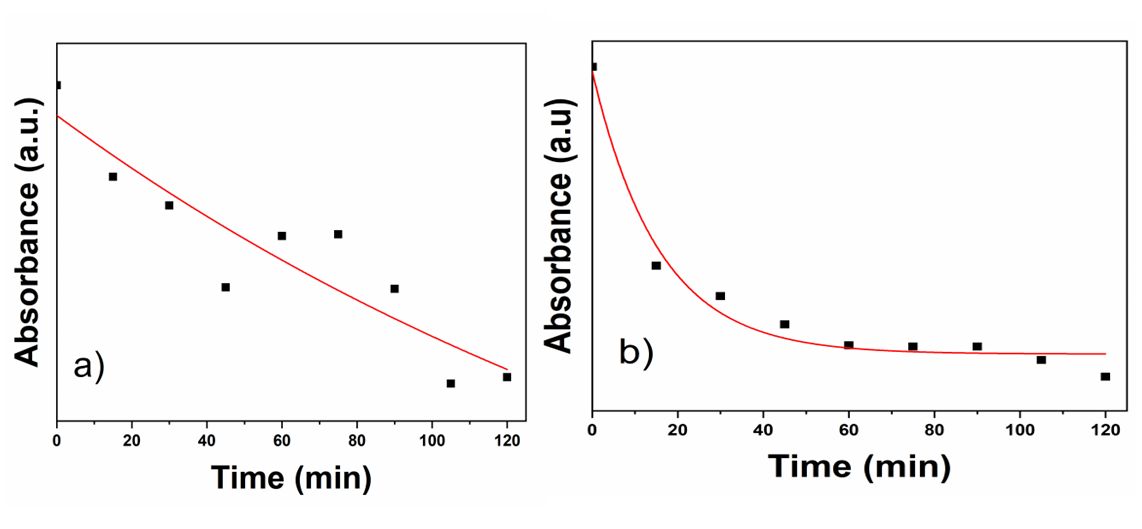
To confirm the degradation process, a kinetic evaluation was conducted. Exponential curves were fitted, and R0 values were determined for each stage of the degradation process, as presented in Fig. 13. A higher modulus of R0 indicates better degradation performance.
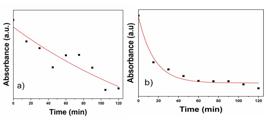
Among the nanofilters, ZnO-ALE/PS showed superior results compared to ZnO/PS. This improved performance is attributed to the morphology of the ZnO-ALE/PS nanofilter, which features a more uniform distribution of ZnO particles within the filter structure. This uniformity allows greater surface exposure of the ZnO particles to the MB solution, as evidenced by the morphological analysis (SEM).
The catalytic efficiency for MB degradation is higher when using pure ZnO nanoparticles without fibers, as they provide a greater number of active ZnO particles to interact with the dye. In contrast, the ZnO-ALE/PS nanofilter benefits from the uniform distribution of ZnO particles within its structure, enhancing its stability and performance. This uniformity prevents particle agglomeration, which could otherwise reduce the filter's efficiency.
On the other hand, the ZnO/PS nanofilter, with less uniform ZnO particle distribution, exhibits lower stability and efficiency in degrading MB. The clustered ZnO particles result in a reduced accessible surface area for interacting with contaminants, thereby limiting its catalytic capacity.
In the PS-based nanofiber filters containing ZnO and ZnO-ALE, the photocatalytic performance is reduced compared to the isolated nanoparticles, primarily due to the restricted surface area available for interaction after incorporation into the polymer matrix. However, embedding the nanoparticles within the PS matrix offers significant practical advantages, including improved handling, mechanical stability, and reusability. Moreover, the matrix acts as an effective physical support, making the material suitable for continuous-flow water treatment applications.
Changes in the electric potential of the nanofibers may enhance intermolecular interactions between ZnO and MB, promoting more effective dye degradation. This improvement, observed in the nanofibers containing ALE during photodegradation, suggests a potential mechanism worth further investigation to explain the enhanced performance noted.
3.7. Photocatalytic degradation mechanism
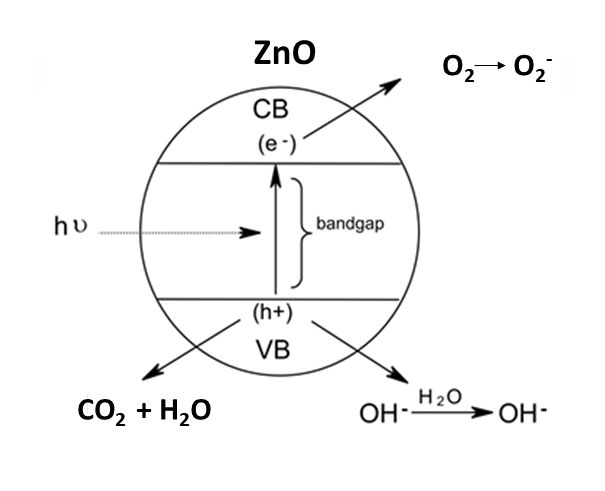
Photodegradation in semiconductors occurs when incident photons promote electrons from the valence band (VB) to the conduction band (CB), generating electron-hole pairs (e−/h+)35. The photogenerated electrons can reduce dissolved O2 to form superoxide anions (•O2−), while the holes oxidize H2O or OH− to produce hydroxyl radicals (•OH), both of which are highly reactive species involved in pollutant degradation. This process is illustrated in Fig. 14.
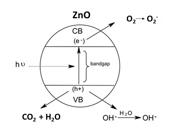
Photocatalytic degradation mechanism of pollutants in the presence of a ZnO-based photocatalyst.
For ZnO under UV irradiation, •OH radicals are widely reported as the dominant species responsible for MB degradation36, with additional contributions from •O2−. The presence of ALE extract may further enhance charge separation and promote higher ROS generation37. Although scavenger tests were not performed in this study, both literature evidence and the obtained experimental results support the conclusion that •OH radicals are the primary active agents driving the photocatalytic activity in the evaluated systems.
3.7.1. Degradation products
Photocatalytic degradation of MB in the presence of semiconductor materials such as ZnO typically proceeds through the formation of organic intermediates, mainly demethylated derivatives like azure A and azure B38. As the process continues, these intermediates are further oxidized to low-molecular-weight organic acids, including oxalic, formic, and acetic acids, which are eventually mineralized into CO2, H2O, NO3−, and SO42−. The extent of complete mineralization depends on the photocatalytic efficiency and the generation rate of reactive oxygen species (ROS). Based on the literature and the degradation efficiencies observed in this study, it is likely that both the ZnO and ZnO-ALE systems promote not only the structural breakdown of MB but also its conversion into stable inorganic end products39.
3.8. Influence of pH
Catalyst composition, crystalline phase, specific surface area, and morphology are critical factors influencing photocatalytic performance. Modifying the catalyst's morphology can significantly enhance efficiency by increasing the exposure of active sites and improving light absorption. Conversely, the formation of aggregates during synthesis or operation may reduce the available surface area, thereby compromising photocatalytic activity40.
Solution pH also plays a crucial role in dye degradation processes due to its effect on surface charge distribution at the photocatalyst–aqueous interface. For ZnO, with a point of zero charge (PZC) around pH 9.0, the surface is positively charged at pH values below this point and negatively charged above it. This charge behavior directly influences the electrostatic interactions between ZnO and dye molecules, affecting both adsorption and photocatalytic efficiency. Previous studies41 have shown that the removal efficiency of MB increases with rising pH, largely due to enhanced electrostatic attraction between negatively charged ZnO surfaces and cationic dye molecules. Furthermore, the photocatalytic degradation of MB was found to follow first-order kinetics under varying pH conditions, with the rate constant increasing at higher pH levels.
Another key factor influencing photocatalytic efficiency is the light source. The wavelength of incident radiation directly affects the photocatalytic degradation rate of dyes such as MB. Studies using low-pressure mercury lamps with emission peaks at 365 nm and 254 nm demonstrated that, despite the lower radiation intensity at 254 nm, the MB degradation rate was significantly higher compared to that under 365 nm irradiation. This enhancement is attributed to the higher photon energy at shorter wavelengths, which more effectively promotes electron-hole (e−/h+) pair generation within the catalyst structure. Additionally, shorter wavelengths increase the density of available electronic states, facilitating electron excitation from the valence band to the conduction band and thereby improving overall photocatalytic efficiency42. These findings highlight the importance of carefully selecting the radiation source, particularly its wavelength, as it directly influences the overall efficiency of contaminant degradation in photocatalytic processes.
The initial concentration of MB is another critical parameter affecting photocatalytic efficiency. Previous studies43,44 have shown that increasing MB concentration leads to a decrease in degradation rate. This reduction is attributed to the higher number of dye molecules adsorbed onto the catalyst surface, which limits the availability of active sites for interactions with reactive species such as photogenerated holes (h+) and hydroxyl radicals (•OH). Excessive surface coverage by MB hinders direct contact between the catalyst and these reactive species, thus reducing photocatalytic activity. Additionally, at higher MB concentrations, increased absorption of UV radiation by the dye solution itself further limits photon penetration to the catalyst surface, reducing the generation of oxidative radicals and compromising degradation efficiency.
3.9. Stability and reusability
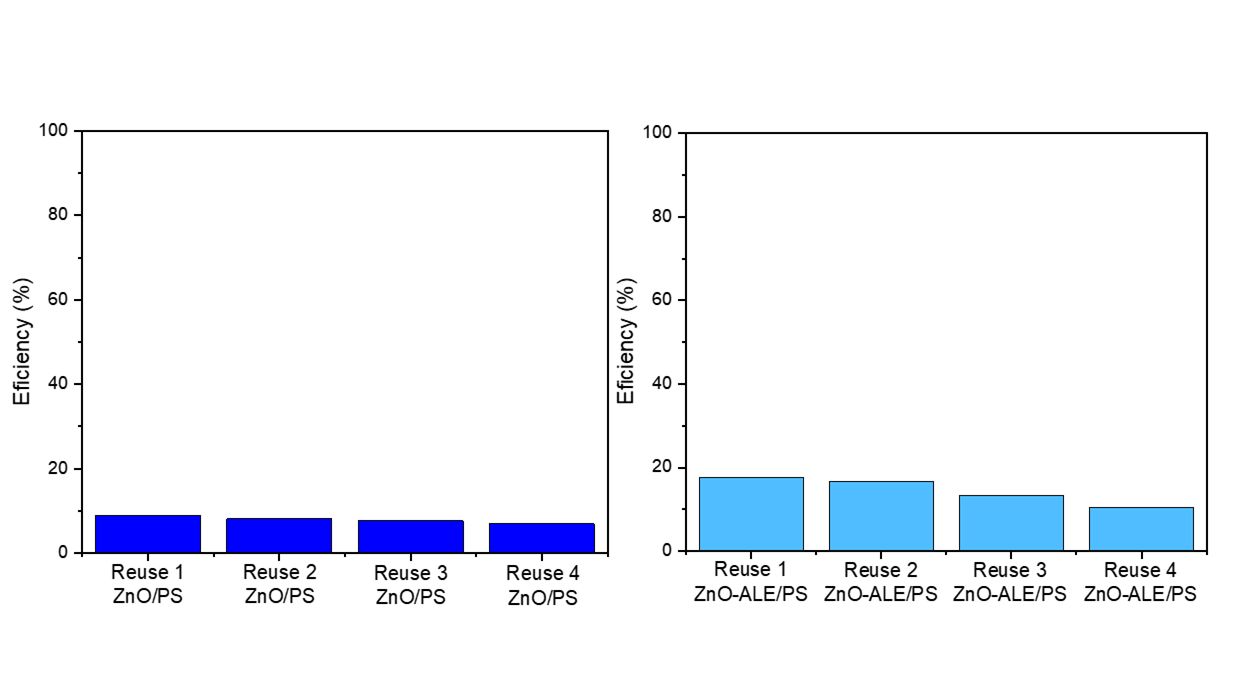
An important aspect of this study was to assess the reusability of the photocatalytic films by evaluating their degradation efficiency over multiple cycles. After each photocatalytic run, the degraded MB solution was decanted and replaced with a fresh MB solution, followed by renewed UV exposure. The absorbance was measured after each cycle to calculate degradation efficiency and monitor catalyst performance.
As shown in Fig. 15, the ZnO-ALE/PS fibers exhibited superior reusability compared to ZnO/PS fibers. This improvement is attributed to the more uniform dispersion of ZnO nanoparticles achieved through ALE-mediated synthesis, which maintained catalytic activity even after the first use and up to three successive reuse cycles.
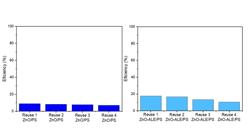
Overall, both photocatalytic films demonstrated good reusability and maintained degradation efficiency despite the relatively low concentration of embedded photocatalysts relative to the contact surface area. This reusability presents a significant advantage in terms of process cost-effectiveness, reducing the need for frequent material replacement, as also reported in previous studies45,46.
3.10. Detection limit
The limit of detection (LOD) is defined as the lowest concentration of an analyte that can be reliably detected with 99% confidence, though not necessarily quantified47. Calibration curves for MB (Fig. 16) exhibited excellent linearity across the tested concentration range, with an R2 value exceeding 0.98, confirming the reliability and validation of the absorbance-based analytical method used to monitor the photocatalytic degradation process.
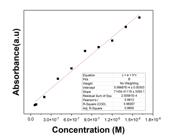
The LOD was calculated using the IUPAC-recommended equation:
where s is the standard deviation of the analytical responses at the tested concentration (5.56 × 10⁻⁷ M) and α is the slope of the calibration curve. The resulting LOD was approximately 2.57 × 10⁻¹¹ M, demonstrating excellent sensitivity of the analytical system, with the capability to detect trace levels of MB. This sensitivity is critical for accurately monitoring the degradation process and evaluating the effectiveness of the proposed photocatalytic system47.
4. Conclusion
In this study, ZnO nanoparticles were synthesized using ALE and incorporated into PS nanofibers, which served as catalysts for the photocatalytic degradation of MB dye under UV-C light (254 nm). UV-Vis analysis revealed a shift in the absorption peak due to the presence of the plasmon band. ZnO@ALE exhibited strong absorption at approximately 210 nm, overlapping with the characteristic ZnO peak at 360 nm, confirming the effectiveness of ALE in the eco-friendly synthesis of ZnO nanoparticles.
Degradation tests demonstrated that pure ZnO nanoparticles outperformed ZnO/PS and ZnO@ALE/PS nanofibers as catalysts. The superior performance of pure ZnO is attributed to its higher surface area-to-volume ratio, which provides more active sites for chemical reactions and dye adsorption, enhancing the interaction between the dye and the catalyst. Furthermore, pure ZnO nanoparticles possess a well-defined crystalline structure, which facilitates the generation of free radicals and the efficient oxidation of the dye.
In contrast, the nanofibers exhibited a less homogeneous distribution of ZnO nanoparticles, which may limit the accessibility of the dye to reaction sites, thereby reducing degradation efficiency. Additionally, the presence of PS in the nanofibers could influence the interactions between ZnO particles and the dye, further hindering the degradation rate. Despite these limitations, degradation was achieved using the nanofilters, suggesting potential for improvement. Future studies could focus on increasing the ZnO content within the polymer matrix to enhance surface area and improve the degradation process.
A significant improvement in the photocatalytic efficiency of the nanofibers was observed when ALE was incorporated. This incorporation enabled more effective photocatalysis compared to fibers without ALE. The advancement is supported by SEM images showing homogeneous and regular surfaces, as well as considerations of enhanced intermolecular interactions and electric potential, highlighting substantial progress in applying nanotechnology for environmental decontamination.
5. Acknowledgments
The authors acknowledge the financial support from the Brazilian agencies Conselho Nacional de Desenvolvimento Científico e Tecnológico – CNPq (grants 311563/2021-0 and 311926/2023-1), CAPES, Fundação de Amparo à Ciência e Tecnologia de Pernambuco – FACEPE (grants APQ-1021-3.03/24).
Data Availability
6. References
-
1 De Felice F, Petrillo A, Zomparelli F, Autelitano F. Circular economy practices in the textile industry for sustainable future: a systematic literature review. J Clean Prod. 2025;486:144547. http://doi.org/10.1016/j.jclepro.2024.144547
» http://doi.org/10.1016/j.jclepro.2024.144547 -
2 Herrador M, Imanishi M. Unlocking the circular economy potential in the textiles and fashion industries of Japan: opportunities for European businesses. J Clean Prod. 2025;486:144491. http://doi.org/10.1016/j.jclepro.2024.144491
» http://doi.org/10.1016/j.jclepro.2024.144491 -
3 Mim IZ, Rayhan I, Syduzzaman M. Prospects and current scenario of industry 4.0 in Bangladeshi textile and apparel industry. Heliyon. 2024;10(11):e32044. http://doi.org/10.1016/j.heliyon.2024.e32044 PMid:38882388.
» http://doi.org/10.1016/j.heliyon.2024.e32044 -
4 Peternela J, Silva MF, Vieira MF, Bergamasco R, Vieira AMS. Synthesis and impregnation of copper oxide nanoparticles on activated carbon through green synthesis for water pollutant removal. Mater Res. 2017;21(1):e20160460. http://doi.org/10.1590/1980-5373-mr-2016-0460
» http://doi.org/10.1590/1980-5373-mr-2016-0460 -
5 Li J, Mubashar M, Zulekha R, Xu C, Zhang X. Applications of coagulation-sedimentation and ultrafiltration for the removal of nanoparticles from water. Separ Purif Tech. 2025;357:129920. http://doi.org/10.1016/j.seppur.2024.129920
» http://doi.org/10.1016/j.seppur.2024.129920 -
6 Tufail A, Al-Rifai J, Price WE, van de Merwe JP, Leusch FDL, Hai FI. Elucidating the performance of UV-based photochemical processes for the removal of trace organic contaminants: degradation and toxicity evaluation. Chemosphere. 2024;350:140978. http://doi.org/10.1016/j.chemosphere.2023.140978 PMid:38135125.
» http://doi.org/10.1016/j.chemosphere.2023.140978 -
7 Ran Y, Sun D, Liu X, Zhang L, Niu Z, Chai T, et al. Chlorella pyrenoidosa as a potential bioremediator: its tolerance and molecular responses to cadmium and lead. Sci Total Environ. 2024;912:168712. http://doi.org/10.1016/j.scitotenv.2023.168712 PMid:38016561.
» http://doi.org/10.1016/j.scitotenv.2023.168712 -
8 Bachhav K, Garde AS. Versatile synthesis of zinc oxide nanoparticles via chemical route: a review. Mater Today Proc. 2023;103:228-36. http://doi.org/10.1016/j.matpr.2023.08.269
» http://doi.org/10.1016/j.matpr.2023.08.269 -
9 Mohammadipour-Nodoushan R, Khodadadi M, Ghasemi E, et al. Improved cotton fabrics properties using zinc oxide-based nanomaterials: a review. Int J Biol Macromol. 2023;242(Pt 4):124916. http://doi.org/10.1016/j.ijbiomac.2023.124916 PMid:37276903.
» http://doi.org/10.1016/j.ijbiomac.2023.124916 -
10 Irede EL, Awoyemi RF, Owolabi B, Aworinde OR, Kajola RO, Hazeez A, et al. Cutting-edge developments in zinc oxide nanoparticles: synthesis and applications for enhanced antimicrobial and UV protection in healthcare solutions. RSC Advances. 2024;14(29):20992-1034. http://doi.org/10.1039/D4RA02452D PMid:38962092.
» http://doi.org/10.1039/D4RA02452D -
11 Da Dalt S, Alves AK, Bergmann CP. Preparation and performance of TiO2-ZnO/CNT hetero-nanostructures applied to photodegradation of organic dye. Mater Res. 2016;19(6):1372-5. http://doi.org/10.1590/1980-5373-mr-2016-0036
» http://doi.org/10.1590/1980-5373-mr-2016-0036 -
12 Faria FP, Ruellas TMO, Roveri CD, Malafatti JOD, Paris EC, Giraldi TR, et al. Obtaining porous zinc oxide ceramics using replica technique: application in photocatalysis. Mater Res. 2021;25:e20210083. http://doi.org/10.1590/1980-5373-mr-2021-0083
» http://doi.org/10.1590/1980-5373-mr-2021-0083 -
13 Ramaprabha K, Ks V. Effective photocatalytic degradation and kinetic modelling of azo dyes by zinc oxide nanoparticles from Brevibacterium casei. Desalination Water Treat. 2025;321:100936. http://doi.org/10.1016/j.dwt.2024.100936
» http://doi.org/10.1016/j.dwt.2024.100936 -
14 Dihom HR, Al-Shaibani MM, Radin Mohamed RMS, Al-Gheethi AA, Sharma A, Khamidun MHB. Photocatalytic degradation of disperse azo dyes in textile wastewater using green zinc oxide nanoparticles synthesized in plant extract: a critical review. J Water Process Eng. 2022;47:102705. http://doi.org/10.1016/j.jwpe.2022.102705
» http://doi.org/10.1016/j.jwpe.2022.102705 -
15 Zaparoli HH, Oliveira M, Pontes FML, Ranzeti MTF, Rinaldo D, Piacenti-Silva M. Green synthesis of zinc oxide nanoparticles: a possible photosensitizing agent in photodynamic therapy. Mater Res. 2024;27(Suppl. 2):e20240156. http://doi.org/10.1590/1980-5373-mr-2024-0156
» http://doi.org/10.1590/1980-5373-mr-2024-0156 -
16 Sathyapriya R, Nilofur Fathima SJ, Arun Paul C, Prakash T, Ranjith Kumar E, Natarajan A. Camellia sinensis assisted green synthesis of metal oxide nanoparticles: investigation of structural, vibrational, morphological and thermal analysis. J Indian Chem Soc. 2024;101(6):101165. http://doi.org/10.1016/j.jics.2024.101165
» http://doi.org/10.1016/j.jics.2024.101165 -
17 Aigbe UO, Osibote AO. Green synthesis of metal oxide nanoparticles, and their various applications. J Hazard Mater Adv. 2024;100401:100401. http://doi.org/10.1016/j.hazadv.2024.100401
» http://doi.org/10.1016/j.hazadv.2024.100401 -
18 Di Confiengo GG, Faga MG, La Parola V, Magnacca G, Paganini MC, Testa ML. Microwave approach and thermal decomposition: a sustainable way to produce ZnO nanoparticles with different chemo-physical properties. Mater Chem Phys. 2024;321:129485. http://doi.org/10.1016/j.matchemphys.2024.129485
» http://doi.org/10.1016/j.matchemphys.2024.129485 -
19 Wang K, Sw S. Controllable synthesis of high porous CuO film on ZnO via electrodeposition for improved sensitivity and stability in nonenzymatic glucose sensing. Mater Lett. 2025;381:137794. http://doi.org/10.1016/j.matlet.2024.137794
» http://doi.org/10.1016/j.matlet.2024.137794 -
20 Ge Y, Xu H-Q, Huang Q, Jia X, Ji H, Ren Q, et al. Microwave-assisted synthesis of Ag/ZnO/diatomite composites for photocatalytic degradation of gaseous toluene. Inorg Chem Commun. 2025;171:113543. http://doi.org/10.1016/j.inoche.2024.113543
» http://doi.org/10.1016/j.inoche.2024.113543 -
21 Demirelli K, Ercan C, Dere A, Yakuphanoglu F. Transition from negative dielectric constant to positive dielectric constant of MXene by addition of ZnO nanoparticles produced by hydrothermal method. J Alloys Compd. 2024;178414. http://doi.org/10.1016/j.jallcom.2024.178414
» http://doi.org/10.1016/j.jallcom.2024.178414 -
22 Cherif S, Rezzaz-Yazid H, Hemidouche S, Farsi A, Mostefaoui S, Belmedani M, et al. Comparative study on the photocatalytic efficiency of ZnO nanoparticles synthesized via chemical and eco-friendly coprecipitation methods. Ceram Int. 2024;51(4):4737-49. http://doi.org/10.1016/j.ceramint.2024.11.448
» http://doi.org/10.1016/j.ceramint.2024.11.448 -
23 Jaishi DR, Ojha I, Bhattarai G, Baraili R, Pathak I, Ojha DR, et al. Plant-mediated synthesis of zinc oxide (ZnO) nanoparticles using Alnus nepalensis D. Don for biological applications. Heliyon. 2024;10(20):e39255. http://doi.org/10.1016/j.heliyon.2024.e39255 PMid:39640779.
» http://doi.org/10.1016/j.heliyon.2024.e39255 -
24 Mahmood AA, Jahan N, Tabassum S, Rahman M, Islam MB, Rahman S, et al. Green synthesis of ZnO and Cu-doped ZnO nanoparticles using Aloe vera gel and investigation of their structural, photocatalytic, and antibacterial properties. Ceramica. 2024;70:eMRCR7435. http://doi.org/10.1590/mrcr7435
» http://doi.org/10.1590/mrcr7435 -
25 Mary KL, Manonmoni JV, Balan AMR, Karthik PS, Malliappan SP. Phytochemical assisted synthesis of Ni doped ZnO nanoparticles using Aloe vera extract for enhanced photocatalytic and antibacterial activities. Dig J Nanomater Biostruct. 2022;17(2):634-40. http://doi.org/10.15251/DJNB.2022.172.634
» http://doi.org/10.15251/DJNB.2022.172.634 -
26 Tamanna NJ, Hossain MS, Bahadur NM, Ahmed S. Green synthesis of Ag2O & facile synthesis of ZnO and characterization using FTIR, bandgap energy & XRD (Scherrer equation, Williamson-Hall, size-strain plot, Monshi-Scherrer model). Results Chem. 2024;7:101313. http://doi.org/10.1016/j.rechem.2024.101313
» http://doi.org/10.1016/j.rechem.2024.101313 -
27 Manasa DJ, Chandrashekar KR, Pavan Kumar MA, Suresh D, Madhu Kumar DJ, Ravikumar CR, et al. Proficient synthesis of zinc oxide nanoparticles from Tabernaemontana heyneana Wall. via green combustion method: Antioxidant, anti-inflammatory, antidiabetic, anticancer and photocatalytic activities. Results Chem. 2021;3:100178. http://doi.org/10.1016/j.rechem.2021.100178
» http://doi.org/10.1016/j.rechem.2021.100178 -
28 Naji HK, Ali HK, Ahmed ZK. ZNO-Ag/PS and ZnO/PS films for photocatalytic degradation of methylene blue. Indones J Chem. 2020;20(2):314-23. http://doi.org/10.22146/ijc.41347
» http://doi.org/10.22146/ijc.41347 -
29 Alves KGB, Felix JF, de Melo EF, dos Santos CG, Andrade CAS, de Melo CP. Characterization of ZnO/polyaniline nanocomposites prepared by using surfactant solutions as polymerization media. J Appl Polym Sci. 2012;125(S1):E141-7. http://doi.org/10.1002/app.35502
» http://doi.org/10.1002/app.35502 -
30 Aghamohamadi N, Sanjani NS, Majidi RF, Nasrollahi SA. Preparation and characterization of Aloe vera acetate and electrospinning fibers as promising antibacterial properties materials. Mater Sci Eng C. 2019;94:445-52. http://doi.org/10.1016/j.msec.2018.09.058 PMid:30423728.
» http://doi.org/10.1016/j.msec.2018.09.058 -
31 Parthasarathy G, Saroja M, Venkatachalam M. Bio-synthesized nano-formulation of zinc oxide-Aloe vera and to study their characterization and antibacterial activities against multiple pathogens. Int J Pharm Sci Res. 2017;8(2):900-7. http://doi.org/10.13040/IJPSR.0975-8232.8(2).900-07
» http://doi.org/10.13040/IJPSR.0975-8232.8(2).900-07 -
32 Mohammed El Amine Z, Lacheheb B, Ouali L. Métodos de reciclagem de resíduos de poliestireno expandido: síntese e caracterização. Phys Chem Res. 2023;11(4):943-51. http://doi.org/10.22036/pcr.2023.365735.2220
» http://doi.org/10.22036/pcr.2023.365735.2220 -
33 Rana SM, Al Amin R, Uz-Zaman A, Talukder SH, Mia NH, Tayyaba S, et al. Application of Aloe vera gel instead of silicon dioxide as organic dielectric material in microelectronics. Mater Sci Pol. 2015;33(3):635-8. http://doi.org/10.1515/msp-2015-0069
» http://doi.org/10.1515/msp-2015-0069 -
34 Jose LM, Raj RSA, Sajan D, Aravind A. Adsorption and photocatalytic activity of biosynthesised ZnO nanoparticles using Aloe vera leaf extract. Nano Express. 2021;2(1):010039. http://doi.org/10.1088/2632-959X/abeec6
» http://doi.org/10.1088/2632-959X/abeec6 -
35 Kulis-Kapuscinska A, Kwoka M, Borysiewicz MA, Wojciechowski T, Licciardello N, Sgarzi M, et al. Photocatalytic degradation of methylene blue at nanostructured ZnO thin films. Nanotechnology. 2023;34(15):155702. http://doi.org/10.1088/1361-6528/aca910 PMid:36595265.
» http://doi.org/10.1088/1361-6528/aca910 -
36 Xu C, Rangaiah GP, Zhao XS. Photocatalytic degradation of methylene blue by titanium dioxide: experimental and modeling study. Ind Eng Chem Res. 2014;53(38):14641-9. http://doi.org/10.1021/ie502367x
» http://doi.org/10.1021/ie502367x -
37 Yadav R, Chundawat TS, Rawat P, Rao GK, Vaya D. Photocatalytic degradation of malachite green dye by ZnO and ZnO–β-cyclodextrin nanocomposite. Bull Mater Sci. 2021;44(4):1-8. http://doi.org/10.1007/s12034-021-02533-z
» http://doi.org/10.1007/s12034-021-02533-z -
38 Houas A, Lachheb H, Ksibi M, Elaloui E, Guillard C, Herrmann JM. Photocatalytic degradation pathway of methylene blue in water. Appl Catal B. 2001;31(2):145-57. http://doi.org/10.1016/S0926-3373(00)00276-9
» http://doi.org/10.1016/S0926-3373(00)00276-9 -
39 Alzahrani HAH, Almulaiky YQ, Alsaiairi AO. The photocatalytic dye degradation of methylene blue (MB) by nanostructured ZnO under UV irradiation. Phys Scr. 2023;98(4):045703. http://doi.org/10.1088/1402-4896/acbe76
» http://doi.org/10.1088/1402-4896/acbe76 -
40 So CM, Cheng MY, Yu J, Wong P. Degradation of azo dye Procion Red MX-5B by photocatalytic oxidation. Chemosphere. 2002;46(6):905-12. http://doi.org/10.1016/S0045-6535(01)00153-9 PMid:11922071.
» http://doi.org/10.1016/S0045-6535(01)00153-9 -
41 Dao TT, Le Na Vo T, Duong AT, Tran DT, Nguyen DL, Pham VV, et al. Highly photocatalytic activity of pH-controlled ZnO nanoflakes. Opt Mater. 2023;140:113865. http://doi.org/10.1016/j.optmat.2023.113865
» http://doi.org/10.1016/j.optmat.2023.113865 -
42 Göktas S. Synergic effects of pH, reaction temperature, and various light sources on the photodegradation of methylene blue without photocatalyst: a relatively high degradation efficiency. Chem Afr. 2024;4425-4437. http://doi.org/10.1007/s42250-024-01036-8
» http://doi.org/10.1007/s42250-024-01036-8 -
43 Poulios I, Aetopoulou I. Photocatalytic degradation of the textile dye reactive orange 16 in the presence of TiO2 suspensions. Environ Technol. 1999;20(5):479-87. http://doi.org/10.1080/09593332008616843
» http://doi.org/10.1080/09593332008616843 -
44 Krishnakumar B, Subash B, Swaminathan M. AgBr–ZnO–An efficient nanophotocatalyst for the mineralization of acid black 1 with UV light. Separ Purif Tech. 2012;85:35-44. http://doi.org/10.1016/j.seppur.2011.09.037
» http://doi.org/10.1016/j.seppur.2011.09.037 -
45 Saravanan R, Mansoob Khan M, Gupta VK, Mosquera E, Gracia F, Narayanan V, et al. ZnO/Ag/CdO nanocomposite for visible light-induced photocatalytic degradation of industrial textile effluents. J Colloid Interface Sci. 2015;452:126-33. http://doi.org/10.1016/j.jcis.2015.04.035 PMid:25935283.
» http://doi.org/10.1016/j.jcis.2015.04.035 -
46 Klymus KE, Merkes CM, Allison MJ, Goldberg CS, Helbing CC, Hunter ME, et al. Reporting the limits of detection and quantification for environmental DNA assays. Environ DNA. 2020;2(3):271-82. http://doi.org/10.1002/edn3.29
» http://doi.org/10.1002/edn3.29 -
47 Hayat M, Shah A, Nisar J, Shah I, Haleem A, Ashiq MN. A novel electrochemical sensing platform for the sensitive detection and degradation monitoring of methylene blue. Catalysts. 2022;12(3):306. http://doi.org/10.3390/catal12030306
» http://doi.org/10.3390/catal12030306