Abstracts
OBJECTIVE: To investigate added sugar intake, main dietary sources and factors associated with excessive intake of added sugar. METHODS: A population-based household survey was carried out in São Paulo, the largest city in Brazil. Cluster sampling was performed and the study sample comprised 689 adults and 622 elderly individuals. Dietary intake was estimated based on a 24-hour food recall. Usual nutrient intake was estimated by correcting for the within-person variance of intake using the Iowa State University (ISU) method. Linear regression analysis was conducted to identify factors associated with added sugar intake. RESULTS: Average of energy intake (EI) from added sugars was 9.1% (95% CI: 8.9%; 9.4%) among adults and 8.4% (95% CI: 8.2%; 8.7%) among the elderly (p < 0.05). Average added sugar intake (% EI) was higher among women than among men (p < 0.05). Soft drink was the main source of added sugar among adults, while table sugar was the main source of added sugar among the elderly. Added sugar intake increased with age among adults. Moreover, higher socioeconomic level was associated with added sugar intake in the same group. CONCLUSIONS: Added sugar intake is higher among younger adults of higher socioeconomic level. Soft drink and table sugar accounted for more than 50% of the sugar consumed.
Added sugars; Food intake; Soft drink; Survey; Adults; Elderly
OBJETIVO: Avaliar o consumo alimentar, principais fontes dietéticas e fatores associados à ingestão acima da recomendação de açúcares de adição. MÉTODOS: Um inquérito populacional domiciliar foi realizado em São Paulo, a maior cidade do Brasil. A população de estudo foi obtida por um processo de amostragem por conglomerados e composta por 689 adultos e 622 idosos. O consumo alimentar foi estimado por um recordatório de 24 horas. Os valores nutricionais foram ajustados pela variância intra pessoal, utilizando o método instituído pela Universidade de Iowa (ISU). A regressão linear foi conduzida para identificar os fatores associados ao consumo de açúcares de adição s. RESULTADOS: A média de energia proveniente dos açúcares de adição foi de 9,1% (IC 95%: 8,9%; 9,4%) entre adultos e 8,4% (IC 95%: 8,2%; 8,7%) entre idosos (p < 0,05). A média do consumo de açúcares de adição foi maior entre mulheres quando comparada à dos homens (p < 0,05). A principal fonte de açúcares de adição foi refrigerante entre adultos, enquanto que entre idosos foi açúcar de mesa. O consumo de açúcares de adição aumentou conforme a idade entre adultos. Além disso, o alto nível socioeconomico esteve associado com o consumo de açúcares de adição entre adultos. CONCLUSÕES: O consumo de açúcares de adição é maior entre adultos de nível socioeconômico alto. Refrigerantes e açúcares de mesa são responsáveis por mais de 50% do consumo de açúcares.
Açúcares de adição; Consumo alimentar; Refrigerantes; Inquérito populacional; Adultos; Idosos
ORIGINAL ARTICLES
Added sugars: consumption and associated factors among adults and the elderly. São Paulo, Brazil
Açúcares de adição: consumo e fatores associados entre adultos e idosos. São Paulo, Brasil
Milena Baptista BuenoI; Dirce Maria Lobo MarchioniI; Chester Luis Galvão CésarII; Regina Mara FisbergI
INutrition Department / School of Public Health, University of Sao Paulo, Sao Paulo, Brazil
IIEpidemiology Department / School of Public Health, University of Sao Paulo, Sao Paulo, Brazil
Corresponding Author Corresponding Author: Milena Baptista Bueno Av. Nossa Senhora do Rosário, 147 apto 31 Serra Negra, SP, Brazil CEP 13930-000 E-mail: mibueno@yahoo.com
ABSTRACT
OBJECTIVE: To investigate added sugar intake, main dietary sources and factors associated with excessive intake of added sugar.
METHODS: A population-based household survey was carried out in São Paulo, the largest city in Brazil. Cluster sampling was performed and the study sample comprised 689 adults and 622 elderly individuals. Dietary intake was estimated based on a 24-hour food recall. Usual nutrient intake was estimated by correcting for the within-person variance of intake using the Iowa State University (ISU) method. Linear regression analysis was conducted to identify factors associated with added sugar intake.
RESULTS: Average of energy intake (EI) from added sugars was 9.1% (95% CI: 8.9%; 9.4%) among adults and 8.4% (95% CI: 8.2%; 8.7%) among the elderly (p < 0.05). Average added sugar intake (% EI) was higher among women than among men (p < 0.05). Soft drink was the main source of added sugar among adults, while table sugar was the main source of added sugar among the elderly. Added sugar intake increased with age among adults. Moreover, higher socioeconomic level was associated with added sugar intake in the same group. CONCLUSIONS: Added sugar intake is higher among younger adults of higher socioeconomic level. Soft drink and table sugar accounted for more than 50% of the sugar consumed.
Keywords: Added sugars. Food intake. Soft drink. Survey. Adults. Elderly.
RESUMO
OBJETIVO: Avaliar o consumo alimentar, principais fontes dietéticas e fatores associados à ingestão acima da recomendação de açúcares de adição.
MÉTODOS: Um inquérito populacional domiciliar foi realizado em São Paulo, a maior cidade do Brasil. A população de estudo foi obtida por um processo de amostragem por conglomerados e composta por 689 adultos e 622 idosos. O consumo alimentar foi estimado por um recordatório de 24 horas. Os valores nutricionais foram ajustados pela variância intra pessoal, utilizando o método instituído pela Universidade de Iowa (ISU). A regressão linear foi conduzida para identificar os fatores associados ao consumo de açúcares de adição s.
RESULTADOS: A média de energia proveniente dos açúcares de adição foi de 9,1% (IC 95%: 8,9%; 9,4%) entre adultos e 8,4% (IC 95%: 8,2%; 8,7%) entre idosos (p < 0,05). A média do consumo de açúcares de adição foi maior entre mulheres quando comparada à dos homens (p < 0,05). A principal fonte de açúcares de adição foi refrigerante entre adultos, enquanto que entre idosos foi açúcar de mesa. O consumo de açúcares de adição aumentou conforme a idade entre adultos. Além disso, o alto nível socioeconomico esteve associado com o consumo de açúcares de adição entre adultos.
CONCLUSÕES: O consumo de açúcares de adição é maior entre adultos de nível socioeconômico alto. Refrigerantes e açúcares de mesa são responsáveis por mais de 50% do consumo de açúcares.
Palavras-chave: Açúcares de adição. Consumo alimentar. Refrigerantes. Inquérito populacional. Adultos. Idosos.
Introduction
The new dietary pattern is characterized by high intake of energy, saturated fats and sugars and low intake of complex carbohydrates and fibers. This diet plays a role as a predisposing risk factor for chronic diseases1.
The literature reports untoward effects from added sugar consumption on health, especially when consumed in large amounts. One of the adverse effects from sugar intake is dental caries, especially when associated with other factors such as genetics, poor oral hygiene, number of meals and fluoride exposure. Some studies show that energy from sugars is related to excessive weight gain and dilution of other nutrients1-3.
Sugars can be added to foods during processing or preparation to improve palatability and increase viscosity, texture, color and durability. Added sugars refer to refined sugar, brown sugar, corn and glucose syrups, fructose-based sweeteners, honey and molasses4.
Based on the World Health Organization (WHO), the Brazilian Food Guide recommends a dietary sugar intake that provides no more than 10% of energy intake (EI)3,5. Brazil is the world's largest producer of sugarcane but few surveys have been published on Brazilian dietary sugar intake.
The Household Budget Survey (2008/2009) showed that consumption of sugars remained at 16.4% of energy intake in the past five years. The maximum of 10% of energy intake from sugars is largely overcome in all socioeconomic levels6.
The objective of the present study was to investigate the main food sources of added sugars among adults and elderly individuals living in the city of São Paulo and the factors associated with excess of added sugar intake, as indicated in the Brazilian Food Guide recommendations.
Methods
Data for this study were obtained from a Health Survey in the city of São Paulo, southeastern Brazil. This population-based household survey was conducted from March to December 2003. The study sample consisted of 1,311 male and female adults (aged 20 to 59 years) and elderly individuals (> 60 years).
Two-stage cluster sampling of census tracts and households was performed. Census tracts were grouped into three strata based on the percentage of family heads with university schooling. In the first stage, ten census tracts were drawn from each of the strata, making a total of 30 census tracts. In the second stage, households were drawn randomly from each census tract. Everyone in the household was invited to participate in the study. Other studies have reported more details on sampling7,8.
To achieve a conservative sample size, the following parameter settings were used: prevalence of 0.5, sampling error of 0.10, alpha of 0.05 and design effect (deff) of 2. The sampling process estimated 200 interviews for each age group and gender: 20 to 59 years old (adults male and female) and 60 years old or over (elderly males and females). Sample size was increased to 400 individuals per group to improve the statistical power.
Exclusion criteria were diabetes, malignant tumors and kidney disease. Adults and elderly individuals with energy intake below 500 kcal/day or above 4,000 kcal/day were also excluded, since these values are unlikely to maintain daily requirements9. The refusal rate was nearly 10% (n = 152) and the exclusion rate was 17.5% (n = 280).
A structured questionnaire on demographic, socioeconomic, family and lifestyle characteristics was applied. Presence of chronic diseases (osteoporosis and hypertension) was reported by interviewees. The International Physical Activity Questionnaire (IPAQ) long version was used to assess physical activity10.
Food intake was assessed using a 24-hour food recall (24HR), including weekends. Interviewers were previously trained. Foods reported in each 24HR were critically reviewed to identify any failures relating to descriptions of foods or preparations consumed. Data were analyzed using Nutrition Data System for Research (NDSR) software11, which was developed by the University of Minnesota, USA. NDSR was adjusted to include typical Brazilian food preparations based on standardized recipes.
A second 24-hour food recall was applied to a subsample of 335 individuals in 2007 to collect information about energy and nutrient intake and provide estimates of variability. In this stage, individuals answered two 24HR recalls. Individuals who developed diabetes, malignant tumors and kidney disease during the period between both data collections were excluded from the study.
After dietary data entry, between and within-individual variability was calculated following the Iowa State University (ISU)12,13 approach using the PC-Side program14. Two parameters needed for external variance adjustment were calculated: the within-person variance component and the fourth moment of intake distribution. For this procedure, a statistical model for gender and age group was performed, including the parameters estimated from the replicate dataset (specific for gender and age group). The jackknife replication method was chosen to estimate the standard error in complex samples. The best linear unbiased predictor (BLUP) of usual individual added sugars and energy intake was also used. BLUPs were outputted from PC-Side program for further analyses by using complex samples in Stata software12,13,15,16.
Sugars added to food during processing or at the time of consumption (table sugars) were considered for the analysis. Foods and preparations contributing to more than 1% of dietary added sugar were identified. The method used was described by Block et al.17.
The analysis was carried out using the survey module of Stata software, version 8.0, which allows adjustments for design effect and weighting.
Student's t-tests were performed to assess the association between added sugar intake (% of EI) and independents variables, such as demographics (gender, skin color, marital status and age), socioeconomics (schooling level and number of durable goods), lifestyle variables (smoking and physical activity) and presence or absence of hypertension and osteoporosis. Variables with significance levels lower than 0.25 in these tests were included in the multiple analysis. The significance level of 5% was set for variables to be included in the final model. Control variables that modified the estimated prevalence ratios of other study variables by more than 20% also remained in the final model.
The study complied with ethical regulations established by the Brazilian National Health Board and was approved by the Research Ethics Committee of São Paulo University and the authors have no conflicts of interests.
Results
Socioeconomic and demographic characteristics of the sample are shown in Table 1. Most of the adults (61%) and a lower proportion of the elderly (25%) had more than eight years of schooling. The majority of the adult and elderly (> 60%) were Caucasian. The proportion of sedentary individuals was high: 79% and 90% for the adults and elderly people, respectively. The prevalence of hypertension (41%) and osteoporosis (17%) was higher among the elderly.
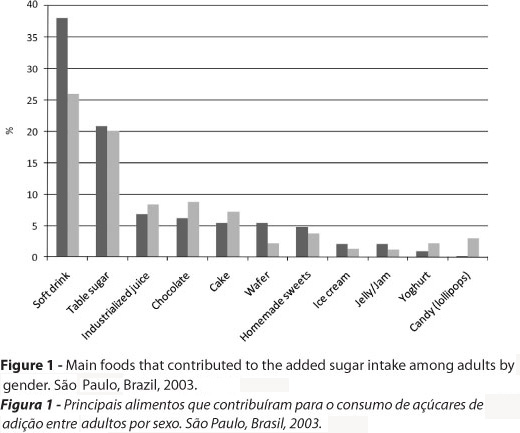
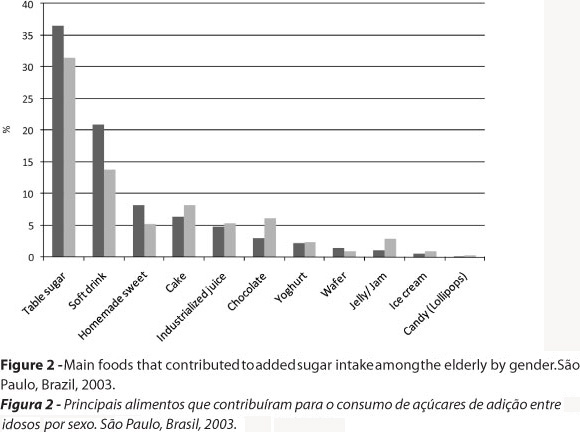
The main food sources of added sugar intake were different by gender and age groups (Figures 1 and 2). Soft drinks were a major source of added sugars among adults, and especially among men. However, table sugar was the major source among the elderly. Soft drinks and table sugar (refined sugar, brown sugar and molasses) represented more than 50% of added sugars in all gender and age groups studied. The food items listed in Figures 1 and 2 accounted for the intake of more than 95% of total added sugars consumed.
Added sugar intake higher than 10% EI was found for 36.7% (95% CI: 33.1%; 40.9%) of all respondents. This percentage differed according to age group: added sugar intake among adults was higher (38.1%) than among the elderly (27.1%). There was no statistical difference relating to gender for either the adults or the elderly (p > 0.05).
Average energy intake (EI) from added sugars was 9.1% (95% CI: 8.9%; 9.4%) among the adults and 8.4% (95% CI: 8.2%; 8.7%) among the elderly (p < 0.05). The average added sugar intake proportional to EI was higher among women than among men (p < 0.05) (Table 2).
The multiple analysis was stratified according to age group. No variable was associated with consumption of added sugar among the elderly. Younger adults consumed more added sugars, as well as those adults with a higher number of durable goods (Table 3).
Discussion
The present study describes usual added sugar intake among a representative sample from the capital of the state of São Paulo. The average contribution of added sugars to total energy intake (9.1%) was below the maximum of 10% of EI that is recommended by the Brazilian Ministry of Health5. However, this result is not very satisfactory, given that among adult women, for example, the proportion of respondents with added sugar intake above the recommended level was 41%. Excess of added sugar intake is more common among younger female adults of a higher socioeconomic level.
The Household Budget Survey (2008/2009)18 showed that the average contribution of added sugars to energy intake in adults and the elderly was between 15.6% and 20.8%, higher values than in the present study. It should be noted that the Household Budget Survey investigated total sugar, as added sugar and other sugars naturally present in foods. The present study only considered added sugars.
Most published studies on added sugar intake have focused on children. Of those investigating adults and elderly individuals, a study by Charlton et al.19 evaluating the diet of 285 African elderly individuals using a 24-hour food recall is noteworthy. These authors reported that the added sugar contribution to EI was 9.3% among men and 9.9% among women, which corroborates the findings in the present study. On the other hand, it should be noted that the African population studied was more economically deprived (14.8% of them had not had access to formal education) and 15% were institutionalized.
Among a sample of 1,097 Irish people aged 18 to 64 years old who completed a seven-day food diary, the average added sugar intake was 9.4% of EI. Comparison of the main food sources showed that the contribution of sugars (refined sugar, brown sugar and molasses) was very similar to what was seen in the present study, but the contribution of sugar from soft drinks was three times higher among the adults living in São Paulo20.
In adult and elderly Americans, the percentage of individuals with added sugar intake higher than 10% of EI ranged from 50 to 70%, depending on life stage and gender21. These values were higher than those observed in this study.
It is important to identify the main food sources of added sugars, since some food items such as cereals and yoghurt not only may be a source of sugar, but also a source of micronutrients, especially when enriched. As observed in the American population22, foods with low nutrient density such as soft drinks (30.7%) and table sugars (13.7%) were major sources of added sugar. However, table sugar intake in this study was higher than in the United States of America.
The contribution of soft drinks to added sugar intake was higher among men and nearly twice as high among adults compared to elderly individuals. In Brazil, soft drink consumption (in grams) was also higher among men and twice as high among adults compared to the elderly18. As in the Brazilian survey18, women have more diversified added sugar intake such as chocolate, cakes and industrialized juices.
Studies about the association between high levels of consumption of sugar-sweetened beverages, especially soft drinks, and obesity are increasing. The hypothesis is that the sugar calories in liquids have little effect on satiety and therefore easily lead to over-consumption23.
Added sugar intake was lower among individuals above the age of 40 years old. Morimoto et al.24 investigated the diet quality of 1,840 people living in the metropolitan area of São Paulo and concluded that the elderly had better dietary quality, because of higher intake of fruits, vegetables and dairy products and lower intake of foods rich in fats. In a few decades, it is assumed that the elderly will not have this pattern of food intake due to the current consumption habits of adults.
High socioeconomic level, identified based on the number of durable goods of adults, was associated with excess of added sugar intake. In the Brazilian survey18, intake of foods high in added sugars such as soft drinks, industrialized juices, chocolates and other sweets was higher among people with higher schooling level.
One limitation of the present study was using only one 24-hour recall. To identify usual intake, the dietary data from at least one subsample of the study population needs to be replicated, in order to correct the energy and nutrient intake for within and between-individual variability13. There is no consensus about the amount of individuals required in the subsample so 25% of the original sample was chosen.
In conclusion, consumption of added sugars was more than the desirable amount, mainly in young female adults. The socioeconomic level was associated with added sugar intake. Public health actions that reach consumers more effectively need to be developed and maintained to reduce the intake of foods that are rich in added sugars, particularly soft drinks. Nutritional education actions are required, starting from the early school years and targeting individuals across all socioeconomic strata. Some actions could help towards developing healthy food habits in adulthood. Furthermore, the amount of added sugars should be included in food labels to help people choose healthier foods.
Recebido em: 21/05/2011
Versão final apresentada em: 29/09/2011
Aprovado em: 17/10/2011
Sources of Funding: This work was supported by State of São Paulo Research Foundation (grant number 2007/514888-2) and Brazilian National Council for Scientific and Technological Development (grant number 402111/2005-2)
-
1[WHO] World Health Organization. Diet, nutrition and the prevention of chronic diseases WHO Technical Series - nº916. Geneva: World Health Organization; 2003.
-
2Murphy SP, Johnson RK. The scientific basis of recent US guidance on sugars intake. Am J Clin Nutr 2003; 78(S4): 827-33.
-
3Nishida C, Uauy R, Kumanyika S, Shetty P. The Joint WHO/FAO Expert Consultation on diet, nutrition and the prevention of chronic diseases: process, product and policy implications. Public Health Nutr 2004; 7(1A): 245-50.
-
4Kranz S, Smiciklas-Wright H, Siega-Riz AM, Mitchell D. Adverse effect of high added sugar consumption on dietary intake in American preschoolers. J Pediatrics 2005; 146: 105-11.
-
5Ministry of Health. Dietary Guidelines for the Brazilian Population Brasília: Ministry of Health; 2006.
-
6Brazilian Institute of Geography and Statistics. Nutritional status and household food availability in Brazil. Brazil: IBGE; 2009.
-
7Castro MA, Barros RR, Bueno MB, César CLG, Fisberg RM. Trans fatty acid intake among the population of the city of São Paulo, Brazil. Rev Saúde Pública 2009; 43(6): 991-7.
-
8Colucci ACA, Cesar CLG, Marchioni DML, Fisberg RM. Relação entre o consumo de açúcares de adição e a adequação da dieta de adolescentes residentes no município de São Paulo. Rev Nutr 2011; 24(2): 219-31.
-
9Willett WC. Nutritional Epidemiology 2nd ed. New York: Oxford University Press; 1998.
-
10IPAQ Research Committee. Guideline for data processing and analysis of the International Physical Activity Questionary (IPAQ) - short and long forms. Available in http://www.ipaq.ki.se Acessed in: Dez. 02, 2011.
-
11Nutrition Coordinating Center. Nutrition Data System [computer program]. Version 2007. Minneapolis: University of de Minnesota; 2007.
-
12Nusser SM, Carriquiry AL, Dodd KW, Fuller WA. A semiparametric transformation approach to estimating usual daily intake distributions. J Am Stat Association 1996; 91: 1440-9.
-
13Dodd KW, Guenther PM, Freedman IS, Subar AF, Kipnis V, Midthune D et al. Statistical Methods for Estimating Usual Intake of Nutrients and Foods: A Review of the Theory. J Am Diet Assoc 2006; 106: 1640-50.
-
14Iowa State University. PC-SIDE [computer program]. Version 1.0. Iowa: Ames; 2003.
-
15Janhs L, Arab L, Carriquiry AL et al. The use of external within-person variance estimates to adjust nutrient intake distributions over time and across populations. Public Health Nutr 2004; 8: 69-76.
-
16Morimoto JM, Marchioni DML, Cesar CLG, Fisberg RM. Variância intrapessoal para ajuste da distribuição de nutrientes em estudos epidemiológicos. Rev Saúde Pública 2011; 45(3): 621-5.
-
17Block G, Hartman AM, Dresser CM, Carroll MD, Gannon J, Gardner L. A data-based approach to diet questionnaire design and testing. Am J Epidemiol 1986; 124: 453-69.
-
18Brazilian Institute of Geography and Statistics. Analysis of individual food consumption in Brazil. Brazil: IBGE; 2011.
-
19Charlton KE, Kolbe-Alexander TL, Nel JH. Micronutrient dilution associated with added sugar intake in elderly black south African . Eur J Clin Nutr 2005; 59: 1030-42.
-
20Joyce T, McCarthy SN, Gibney MJ. Relationship between energy from added sugars and frequency of added sugars intake in Irish children, teenagers and adults. Br J Nutr 2008; 99: 1117-126.
-
21Marriott BP, Olsho L, Hadden L, Connor P. Intake of Added Sugars and Selected Nutrients in the United States, National Health and Nutrition Examination Survey (NHANES) 2003-2006. Crit Rev Food Sci Nutr 2010; 50: 228-58.
-
22Guthrie J, Morton JF. Food sources of added sweeteners in the diets of americans. J Am Diet Assoc 2000; 100(1): 43-51.
-
23Baak MAV, Astrup A. Consumption of sugars and body weight. Obes Rev 2009; 10 (S1): 9-23.
-
24Morimoto JM, Latorre MRDO, Cesar CLG, Carandina L, Barros MBA, Goldbaum M et al. Factors associated with dietary quality among adults in Greater Metropolitan São Paulo, Brazil, 2002. Rep Public Health 2008; 24(1): 169-78.
Publication Dates
-
Publication in this collection
14 Mar 2013 -
Date of issue
June 2012
History
-
Received
21 May 2011 -
Accepted
17 Oct 2011 -
Reviewed
29 Sept 2011