 Responses of anuran assemblages to the urban-rural gradients in a high biodiversity tropical region
Abstract
The responses of biodiversity to urban gradients are poorly characterized in tropical cities. We investigated the taxonomic structure of anuran assemblages along the urban-rural gradients in Tabatinga, an Amazonian city in a region with the highest amphibian diversity in the world. We carried out quantitative censuses of anurans in transects distributed in urban, peri-urban, rural and minimally disturbed forests. We sampled 2,841 individuals belonging to 51 anuran species. Rural and peri-urban habitats showed similar species richness, and both are richer than urban habitats. Species abundance distribution in urban transects was more strongly dominated by fewer species than peri-urban, rural and terra-firme forest habitats. Species composition was similar between urban, peri-urban, and rural habitats, with the anuran assemblages displaying a nested arrangement in the species distribution. Anuran alpha diversity was positively affected by distance from a major river and the amount of green area around transects. In contrast, the alpha diversity of anuran species is negatively influenced by increasing the number of utility poles. Studies around the world suggest that urban habitats in cities may harbor a diverse fauna of anurans. The maintenance of urban protected areas by municipal governments may be relevant for the conservation of amphibians in the Amazon.
Key words
Amphibians; Tropical Cities; Urban Biodiversity; Urban Protected Areas
INTRODUCTION
Urbanization is a complex socioenvironmental phenomenon that causes major changes in biological assemblages (McKinney 2002). In many cities, native and habitat specialist organisms are lost, and most ecological space is occupied by habitat generalists and exotic species (McKinney 2006). However, the habitats occupied by species in the urban landscapes are not homogenously distributed within and around the cities (McDonnell et al. 1997, Beninde et al. 2015). Typically, densely populated urban sectors are strongly modified, and these alterations tend to be less intensive in the peripheral areas of the cities and in rural areas (McDonnell et al. 1997, McKinney 2002, Radeloff et al. 2005).
Environmental gradients within cities (urban gradients) and beyond their boundaries (urban-rural gradients) act as filters for species richness, abundance and composition (Clergeau et al. 2001, Beninde et al. 2015, Padilla & Sutherland 2019). Indeed, social and environmental factors that vary along gradients such as vegetation cover, impervious surfaces, noise pollution, human density and the socioeconomic status of the residents affect plant and animal assemblages (Hope et al. 2003, Fontana et al. 2011, MacGregor-Fors & Schondube 2011, Smallbone et al. 2011, Luck et al. 2013, Saito & Koike 2013, Zhang et al. 2016).
The influence of urban environmental gradients on species distribution partly depends on the taxonomic groups and their ecological attributes (Saito & Koike 2015, González-Césped et al. 2021). Anurans are the terrestrial vertebrates that are most affected by environmental disturbances associated with urbanization (Cordier et al. 2021, Yang et al. 2022). In urban environments, anurans are threatened by: i) danger of desiccation due to their permeable skins, ii) predation by domestic animals such as dogs and cats, iii) noise pollution that affects their vocal behavior during breeding seasons, iv) deaths caused by vehicle traffic, v) chemical pollution of waterbodies used for reproduction and vi) local extinction caused by fragmentation and habitat loss (Lehtinen et al. 1999, Cushman 2006, Hamer & McDonnell 2008).
Despite these threats, some natural and semi-natural habitats (e.g., artificial ponds, forest fragments and urban parks) found in cities could harbor a relevant portion of the regional assemblages of anurans, including threatened, endemic and rare species (e.g., Lourenço-de-Moraes et al. 2018, Avila-Pires et al. 2018). Thus, urban ecosystems can contribute in a valuable way to species conservation (Spotswood et al. 2021). In this sense, understanding which biotic and abiotic variables affect anuran assemblages along urban-rural gradients can provide guidelines for managing the cities so as to improve their benefits to anurans and other organisms. These studies may be even more helpful in small cities whose administrators have better opportunities to plan urban development.
Understanding the anuran responses to urbanization gradients is especially challenging in regions with high diversity of poorly known species, such as the Amazon rainforest. No place in the world has more anuran species than the Amazon basin, with an estimated diversity of 800 species (Vacher et al. 2020). Although the Amazon rainforest is rightly famous for its luxuriant forest cover, urbanization in the region has advanced in the last decades (Chein & Procópio 2022). Just how the Amazonian biodiversity is affected by this increase in urbanized areas is still poorly assessed.
Here, we investigate the taxonomic structure of anuran assemblages along urban-rural gradients in a small city located in the western Brazilian Amazon, one of the regions with the greatest diversity of anurans in the world (Jenkins et al. 2015, Godinho & Silva 2018). We describe the anuran diversity, abundance and composition changes and identify variables that potentially influenced species occurrence along the urban-rural gradient. In addition, we evaluated some simple metrics of urbanization that could directly or indirectly affect the abundance and diversity of anurans.
Based on previous studies (e.g., Oda et al. 2017, Lourenço-de-Moraes et al. 2018, Silva & Scudeller 2022) we expected that: i) alpha diversity and species distribution abundance will change from the highly urbanized sites to less disturbed rural regions, with peri-urban and rural sites harboring more species and being less dominated by few species; ii) the beta diversity of anuran assemblages in the studied gradient will be dominated by the similarity in species composition; iii) the species will be distributed in a nested arrangement where low diversity sites will be composed of an impoverished set of species from the richer sites; iv) local and landscape variables that indicate intensity and time since urbanization will be the most influential in the assemblages of anurans.
MATERIALS AND METHODS
Study area
We sampled anurans in the municipality of Tabatinga, which is located in the western portion of the Brazilian Amazon on the triple frontier between Brazil, Peru and Colombia. The Solimões River delimits the border between Tabatinga and Peru, and Tabatinga’s urban area is contiguous with that of Leticia, a Colombian city (Figure 1). The municipality covers 3,260 km², but the currently urbanized area of Tabatinga is only 17.02 km², and its population is estimated at 66,764 inhabitants (https://cidades.ibge.gov.br).
Municipality of Tabatinga showing the sampled transects in urban (red lines), peri-urban (yellow lines), rural (purple lines), and terra-firme forest (light green lines). Acronyms indicates the habitat and number of the site with U for urban, P for peri-urban, R for rural and F for terra-firme forest. Lines surrounding transects represent the 100-meter buffer area where the landscape variables were estimated.
The dominant vegetation types in the study region are terra-firme forests and alluvial varzea (floodplain) forests, the latter being subject to different levels of flooding, with small areas used in agricultural activities (https://plataforma.brasil.mapbiomas.org). The regional climate is equatorial, with a minimum annual temperature of 22 ˚C and annual precipitation of 2,250 to 3,000 mm (https://www.climatempo.com.br/climatologia/1615/tabatinga-am).
Anurans and environmental data sampling
We sampled anurans in 22 transects of 300 meters each, along the urban-rural gradient, which were divided into three major environments: urban (nine transects), peri-urban (six transects), and rural (five transects). Urban and peri-urban transects were categorized using local density of houses, other urban infrastructure and proximity to rural environments. In addition, we established two further transects in the terra-firme primary forests to make a preliminary inventory of anuran diversity in undisturbed habitats (Figure 1). Transects were set along asphalted or dirt roads and trails, and were sampled four times between April and September 2019, which corresponds to the transition from the rainiest months to the start of the dry season.
Anurans were recorded through audio-visual censuses limited by time between 6:00 pm and 10:00 pm (Heyer et al. 1994). Each transect was sampled for at least one hour, and two transects were sampled each night. The sampling route was reversed during the four sampling occasions to permit inventorying of different parts of the transects in various time periods. In total, 48 nights and around 428 hours of sampling were invested in the fieldwork.
During the anuran censuses, the field teams ranged from one to five people, and in most sampling sessions, at least three assistants helped to collect the data. Anuran recordings were made only by WVS at five equidistant points along the transects for 10 minutes at each point. Visual records were made by researchers on both sides of the transect and the position of each anuran detected was estimated as inside distance belts of 0-5 m, 5-10 m, 10-15 m, and beyond 15 m.
We made collections of a few voucher specimens of each species since the diversity of anurans in the study region is poorly known. Specimens were anesthetized and then euthanized with 5% lidocaine hydrochloride, fixed in formaldehyde, stored in 70% ethanol, and deposited in the Prof. Paulo Bührnheim Zoological Collection at the Federal University of Amazonas (CZPB–UFAM). Anurans were identified using Rodríguez & Duellman (1994), Duellman (2005), Lima et al. (2012) and the taxonomic nomenclature following Frost (2023).
We collected local and landscape variables to represent a gradient of urbanization that likely influences the amphibians’ reproduction, dispersal and survival of amphibians. Then, the following local environmental variables were collected along the transects number of utility poles, number of people and vehicles, and number of dogs and cats. Besides being an urbanization proxy, utility poles provided nocturnal illumination that could influence anuran abundance and distribution since most species are mainly active at night (Baker & Richardson 2006). Movements of people along the transects could drive away the anurans, and the intensity of vehicle traffic increases noise pollution and could also contribute to direct mortality of these organisms (Bee & Swanson 2007, Hamer & McDonnell 2008). Finally, dogs and cats could be relevant predators of frogs in urban habitats (Hamer & McDonnell 2008). The number of utility poles and dogs and cats were counted along the transects during the sampling of the anurans. The number of people and vehicles was counted during one minute at the beginning and end of each transect.
Satellite images were used to obtain the smaller linear distance from each transect to the Solimões River and the percentage of green area, considered here as landscape variables. The percentage of green area was quantified within a buffer area of 100 meters around each transect using ArcGIS Online 10.5. The distance from the river was obtained using Google Earth Pro (version 7.3.2) from a fixed point on the Solimões River to the starting point of each transect. Distance from the river was treated as a proxy for urban expansion, with the city’s oldest parts located near the river (Figure 1). In addition, habitats associated with margins (flooded forests) and channels (floating meadows) of Amazonian rivers are home to distinctive anuran assemblages (Ramalho et al. 2016, Fonte et al. 2021) and can function as faunal sources for anurans that colonize the city.
Data analysis
The abundance of anuran species in the transects was quantified as the maximum number of individuals of each species recorded in the four sampling occasions to avoid counting the same individuals. We excluded the terra-firme forest transects from most analyses due to low sampling efforts applied in this habitat. However, we reported the data from the terra-firme forest for a preliminary assessment of regional anuran diversity.
The alpha diversity of each major habitat was quantified using the Hill numbers and extrapolated to a common number of individuals in each habitat (Colwell et al. 2012, Chao et al. 2014, Roswell et al. 2021). Using the Hill numbers, diversity indices are calculated that varied in how they are affected by rare species (Roswell et al. 2021), including species richness (q0 - strongly affected by rare species), Shannon diversity (q1 - near equally influenced by rare and abundant species), and Simpson diversity (q2 - focusing in the most abundant species). Due to this property, Hill numbers provided a more accurate description of variation in local alpha diversity along the studied gradient (Roswell et al. 2021). We used the Inext tool (https://chao.shinyapps.io/iNEXTOnline/) for cumulative and extrapolation diversity analysis using the Hill numbers.
The species abundance distribution was analyzed with K-dominance curves, plotting the percentage of cumulative abundance against species rank on the log scale (Lambshead et al. 1983, Matthews & Whittaker 2015). We built abundance curves for each transect and computed a dissimilarity distance matrix for each pair of curves using a modified Manhattan distance (Clarke & Warwick 2001). This dissimilarity matrix was analyzed with an ANOSIM (analysis of similarity) to test for differences in the dominance curves between the four major sampled habitats with statistical significance provided by a permutation procedure detailed in Clarke & Warwick (2001). Dominance curves were exhibited as partial curves, which diminished the influence of the single most abundant species (Clarke & Warwick 2001).
We adopted complementary approaches to quantify the anuran beta diversity. Ordinations of studied sites were made using non-metric multidimensional scaling (NMDS) analysis based on quantitative data (relative abundance) using the Bray-Curtis dissimilarity index and presence/absence data using the Simpson indices. Simpson indices are not affected by differences in species richness among the sites compared (Lennon et al. 2001, Baselga 2010), which is a good feature given the high variation in the number of species in the sampled habitats and transects.
In addition, we applied the approach of Podani & Schmera (2011) to decompose the beta diversity in the components of species similarity (S), differences in species richness (D) and species replacement or turnover (R). The contribution of these components of beta diversity is proportional, and the results are displayed in SDR-simplex plots or ternary plots (Podani & Schmera 2011). This visualization mode is an effective way to interpret the influence of beta diversity components extracted from the presence-absence matrices. The beta diversity decomposition was made using the SDR Simplex program (Podani & Schmera 2011), and the results are displayed in graphs extracted from the SYN-TAX 2000 package (Podani 2001).
We used indicator species analysis (Dufrêne & Legendre 1997) to identify the anuran species with the greatest association with the different habitats along the studied gradient using the PAST program (Hammer et al. 2001). In this analysis, an indicator value (IndVal) is calculated for each species, considering their relative abundance (specificity) and relative frequency (fidelity) across the different treatments (Dufrêne & Legendre 1997). Indicator values range from 0 to 100, and statistical significance is estimated using permutation procedures (Dufrêne & Legendre 1997).
We investigated the influence of local and landscape variables in the anuran diversity measurements using hierarchical partition (Mac Nally 2000). The local environmental variables used were the number of utility poles, the number of vehicles + people, number of pets (dogs + cats), the distance from the Solimões River and the percentage of green area around the transect. The dependent variables in the models were species richness, Fisher’s alpha diversity, abundance (number of individuals counted), and Pielou index of equitability.
RESULTS
Alpha diversity and abundance
We sampled 2,841 individuals belonging to 52 amphibian species distributed in nine families (see Supplementary Material – Table SI). Detailed information on the natural history, taxonomy and the biogeography of the amphibian species is outside the scope of the current study and will be presented in a separated publication. The only non-anuran species recorded during the census was the salamander Bolitoglossa altamazonica (Plethodontidae) with three individuals being sampled in the terra-firme forest transects. The primary terra-firme forest had the greatest diversity, with 38 anuran species, and the lowest abundance due to the limited sampling effort (Table I). The peri-urban and rural transects housed a similar number of species, although the highest number of individuals was sampled in the peri-urban sites (Table I). Urban transects harbor 14 anurans species (Table I). As expected, the terra-firme forest had the most distinctive assemblage, with 19 species uniquely recorded in this habitat (Table I). Rural and peri-urban habitats harbor 1 and 2 exclusive species, respectively, but no anuran species were recorded only in the urban habitats (Table I).
Diversity and abundance of anuran species distributed in the sampled environments. In parentheses are average values between transects and range.
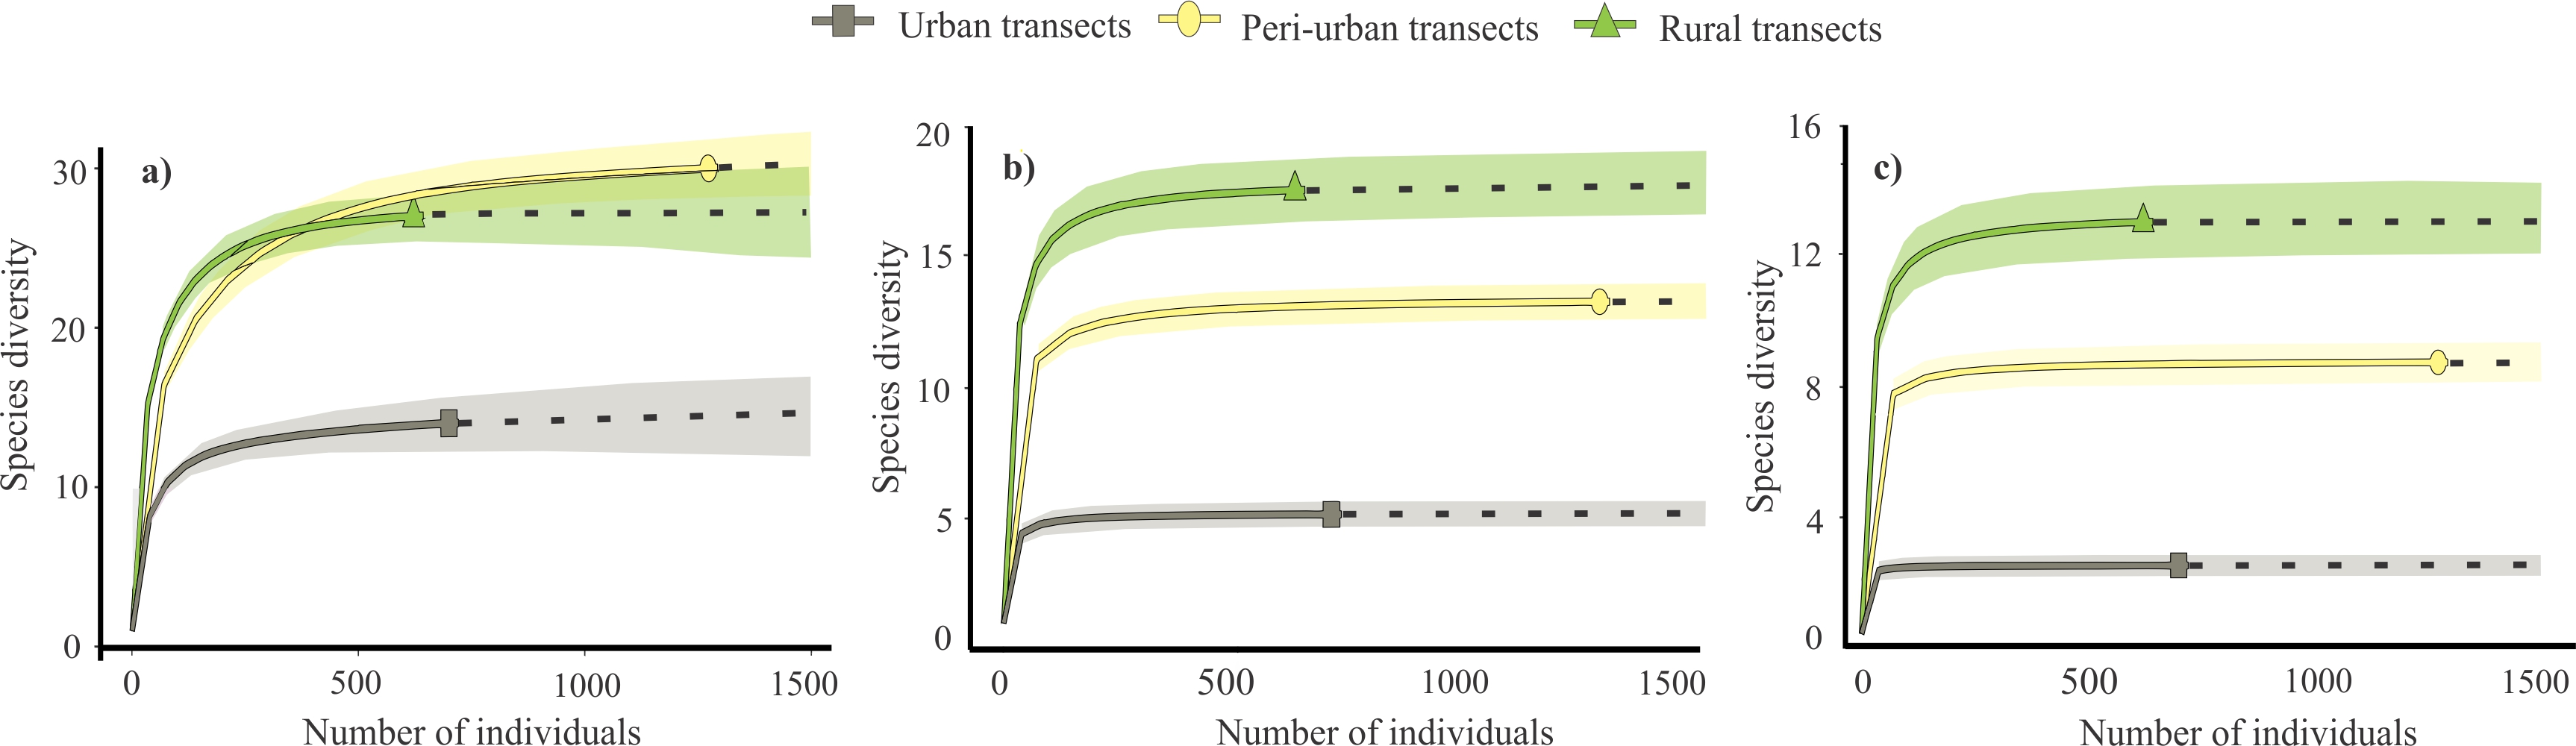
Rural and peri-urban habitats present similar alpha diversity when measured using species richness (q= 0), and both are richer than urban habitats (Figure 2a). However, when species relative abundance is considered (q= 1 and q= 2), rural habitats had higher alpha diversity than peri-urban habitats, and both are more diverse than urban habitats (Figure 2b, c).
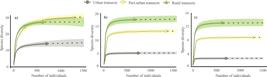
Curves of anuran alpha diversity along the urban-rural gradient of Tabatinga extrapolated to equal sampling effort using the Hill numbers: a) species richness, b) Shannon diversity and c) Simpson diversity. Colored shades represent 95% confidence intervals resulting from 100 permutations.
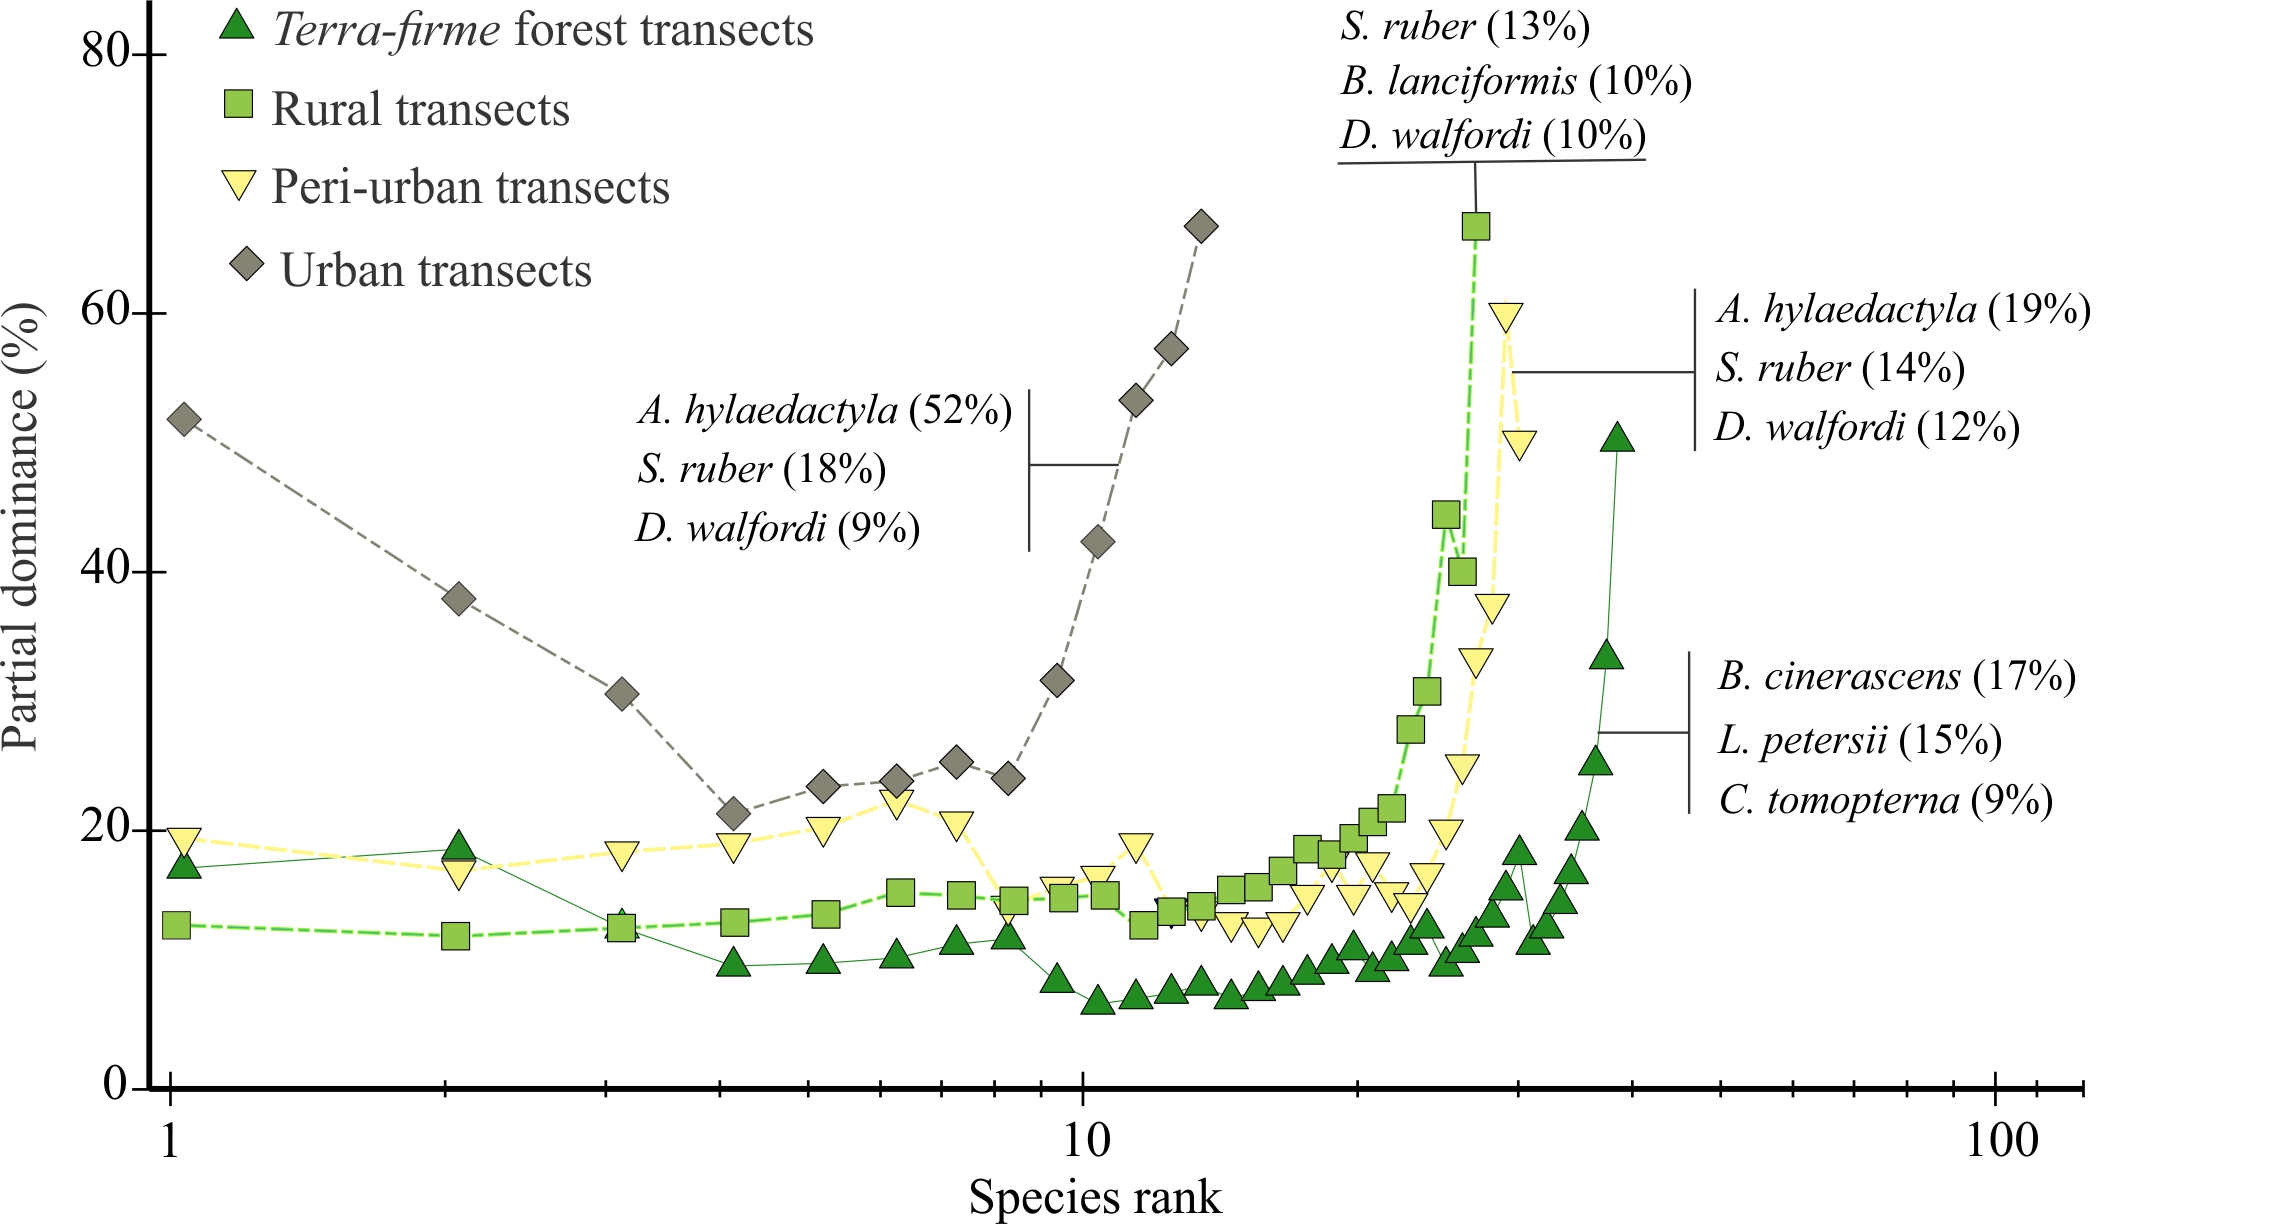
The curves of species abundance distribution (SAD) indicate that urban habitats present higher species dominance when compared to terra-firme forests (R = 0.97, P = 0.02), peri-urban habitats (R = 0.69, P < 0.01), and rural habitats (R = 0.91, P < 0.01) (Figure 3). Individual distribution among species was more equitable and similar in peri-urban habitats, rural habitats and terra-firme forests, with the SAD curves being not statistically distinct in the paired comparisons (Figure 3). Although the most abundant species were the same in urban, peri-urban and rural habitats, their relative contribution to the SAD curves was distinct, especially in the urban habitats where a single species (Adenomera hylaedactyla) made up more than half of the sampled individuals (Figure 3).
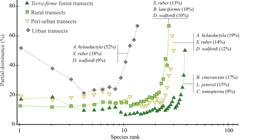
K-dominance curves show the abundance distribution of anuran species in the studied environments. The three most abundant species and the percentage of individuals sampled in each habitat are shown.
Species composition and indicator species
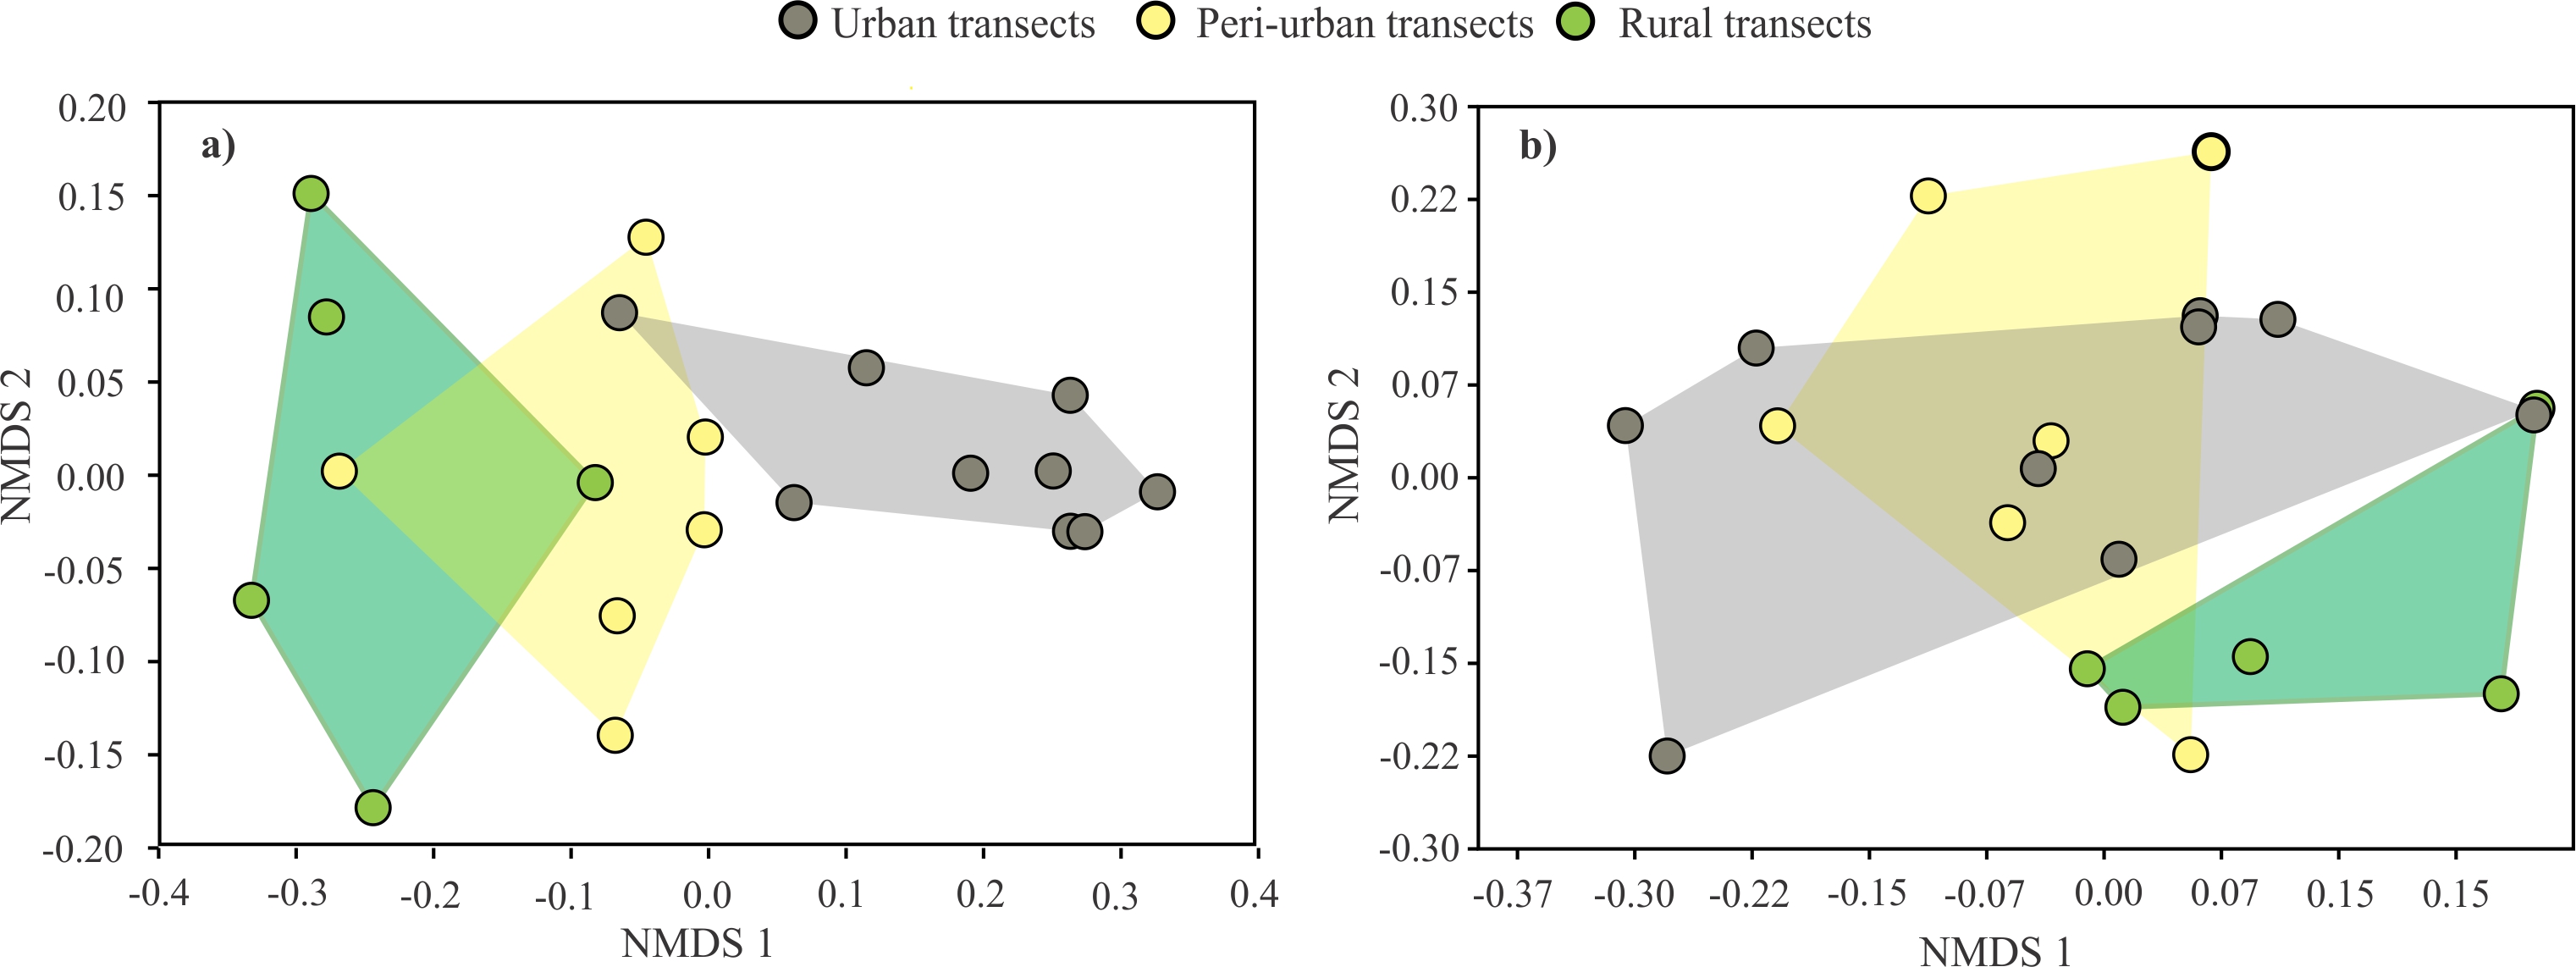
Urban, peri-urban and rural transects form distinctive groups in the ordination of sampling sites using quantitative data (Figure 4a). Urban sites had a species composition that was distinct from peri-urban (ANOSIM, R = 0.63, P < 0.01) and rural habitats (ANOSIM, R = 0.85, P < 0.01). In addition, peri-urban habitats had a distinct composition when compared to rural habitats (ANOSIM, R = 0.51, P < 0.01).
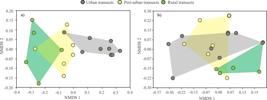
Ordinations of transects (colored circles) through non-metric multidimensional scaling (NMDS) using the Bray–Curtis distance with relative abundance data (a) and Simpson distance with presence/absence data (b).
A sharply contrasting result is obtained when the ordination analysis is based on presence-absence data (Figure 4b), which shows no statistical differences in species composition between habitats (ANOSIM, R = - 0.07, P < 0.81). This result is consistent with the fact that the disturbed sampling habitats having either none or few exclusive species (Table I), and it indicates that the compositional differences between habitats are mainly due to relative abundance of species.
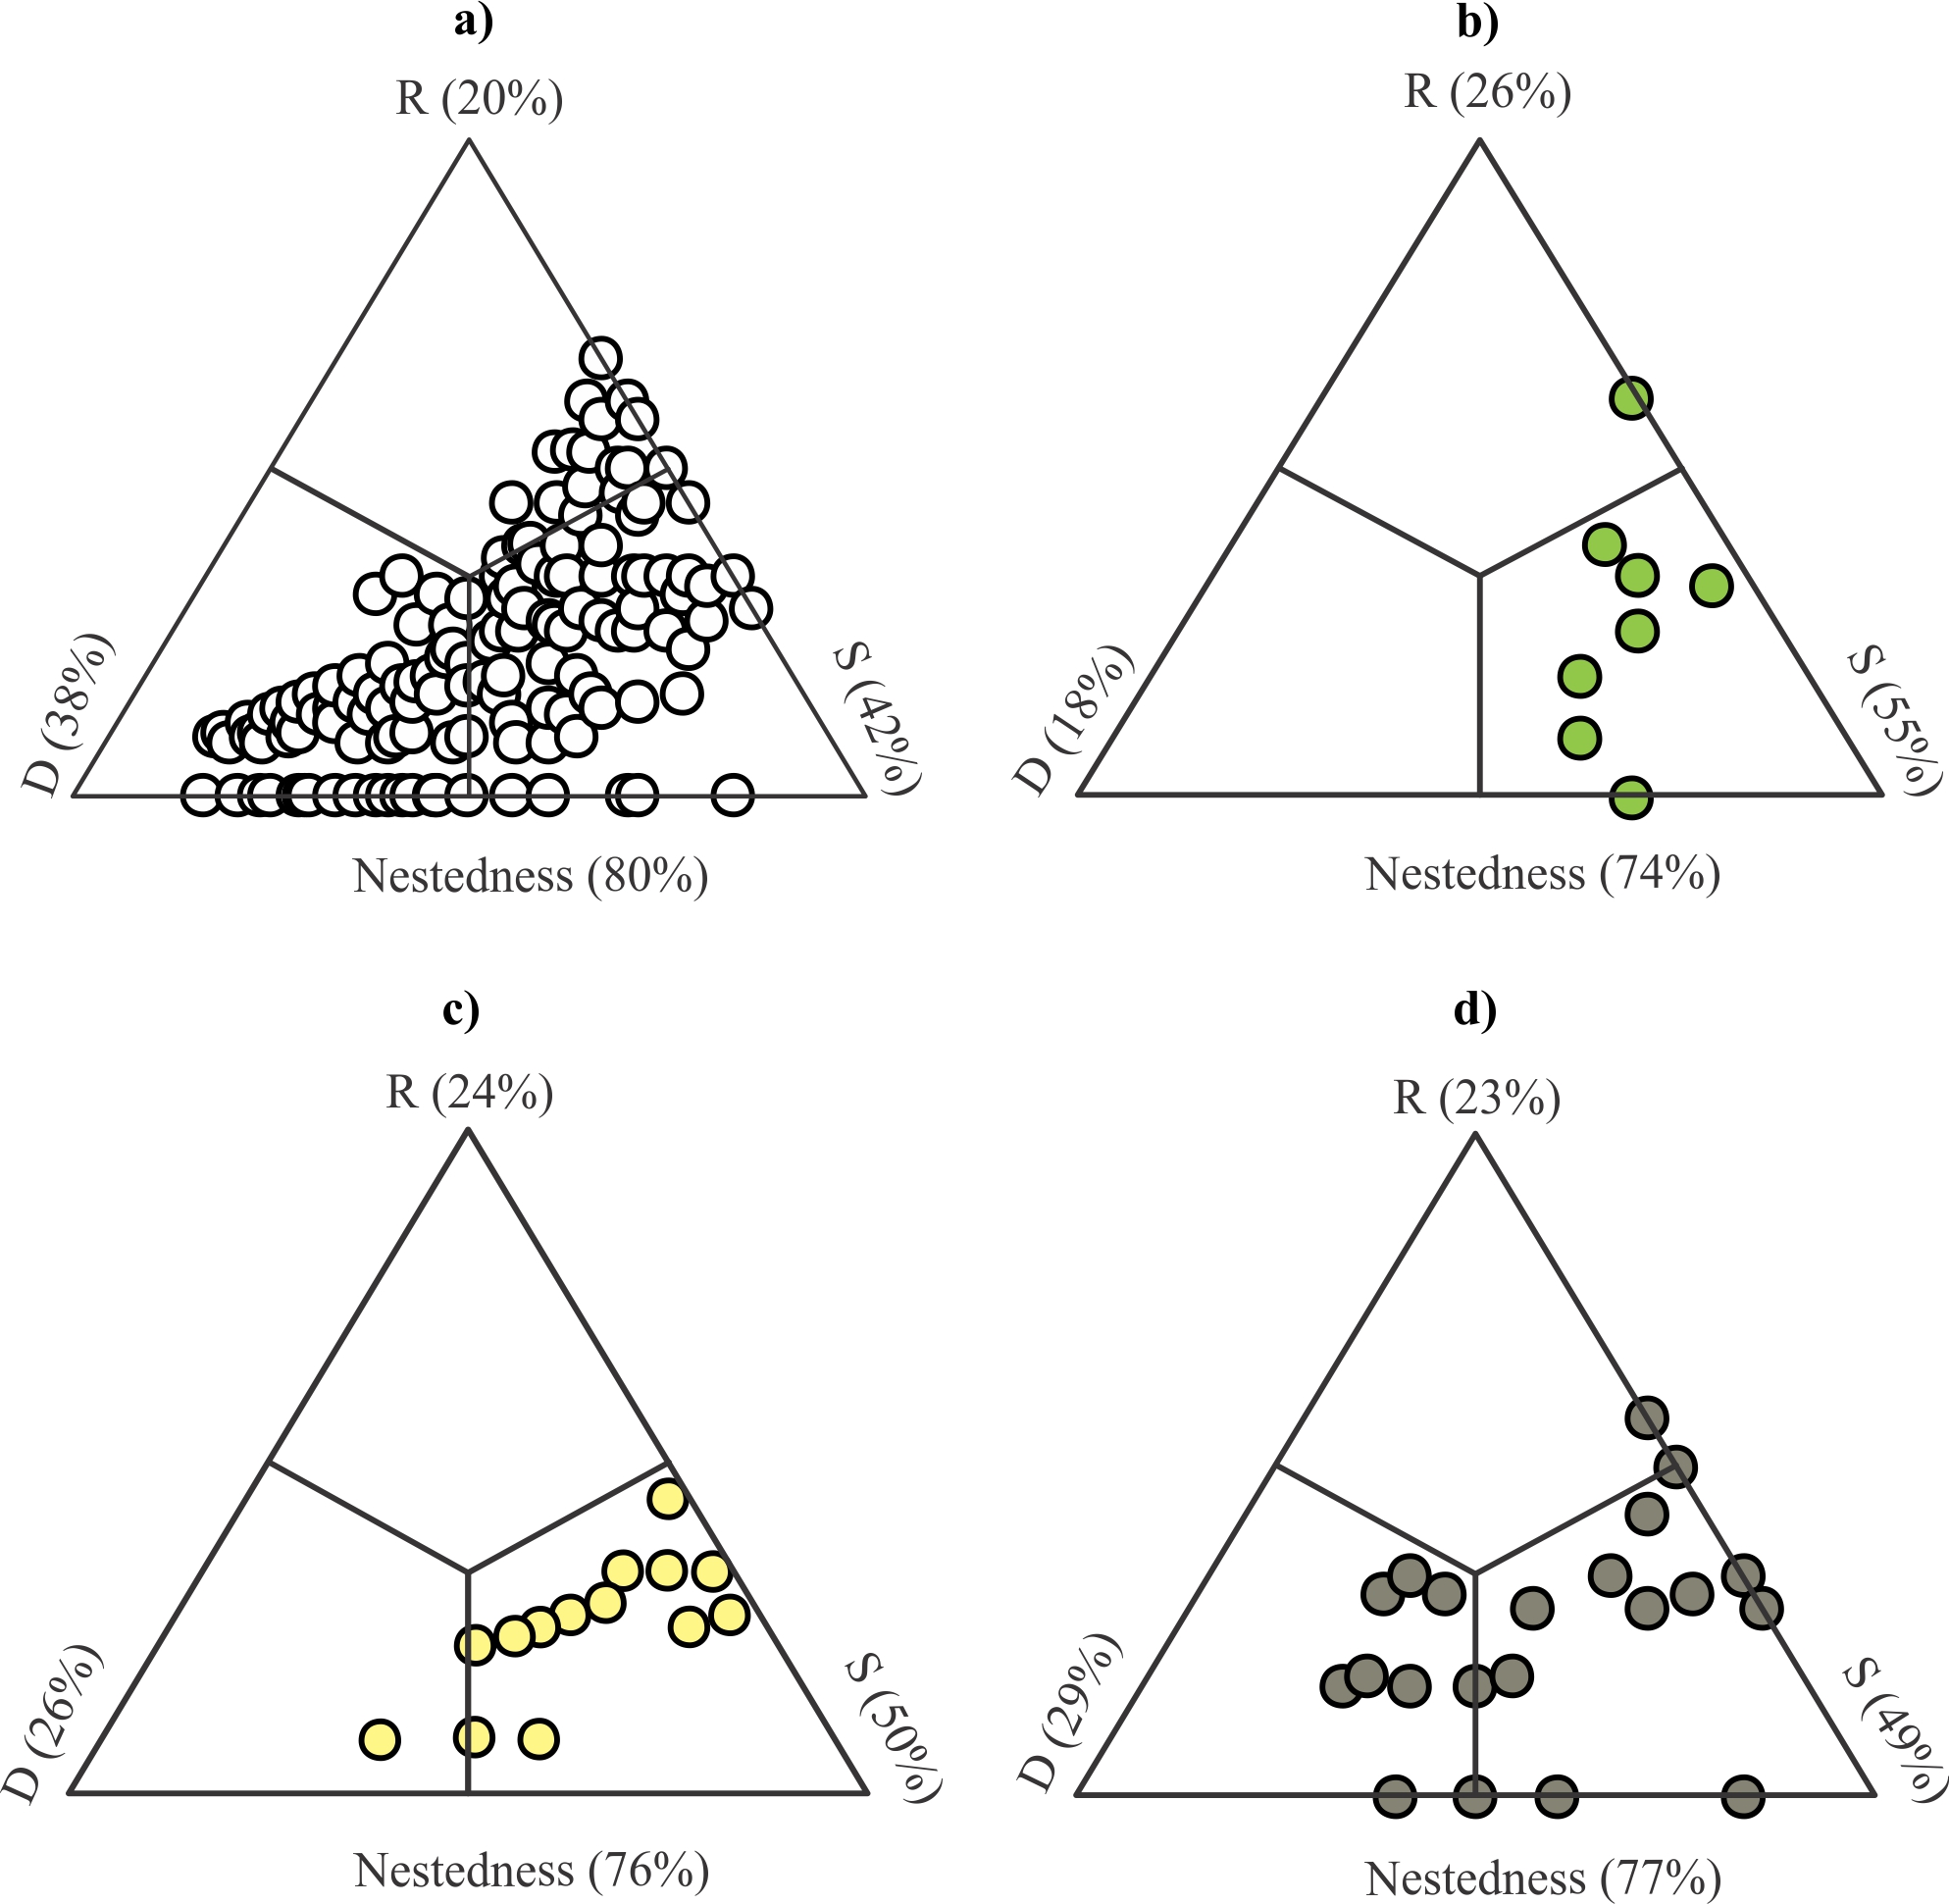
Reinforcing the previous result, species similarity made a major contribution to beta diversity patterns, followed by differences in species richness and a modest contribution of species replacement (Figure 5a). In addition, the anuran assemblages displayed a strong nested arrangement in the species distribution (Figure 5a). The relative contribution of these components was maintained when the analysis was separated by the studied habitats (Figure 5b-d).
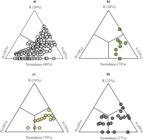
Ternary plots show the decomposition of beta diversity into components of replacement (R), similarity (S) and difference in the number of species (D) with different datasets: a) all sampled transects, b) only rural transects, c) only peri-urban transects and d) only urban transects.
We identified 16 anuran species that were significantly associated with a particular habitat along the studied gradient, including eight species that were associated with rural habitats, seven with peri-urban and only one species (Leptodactylus pentadactylus) associated with urban habitats (Table II). Rural species tend to be larger (mean snout-vent length = 61 mm), mainly arboreal and are nocturnally active. Peri-urban species are smaller (mean snout-vent length = 36 mm) and associated with non-forest habitats, with some species being terrestrial and other arboreal. The only species associated with urban habitats is a relatively large (mean snout-vent length = 63 mm) terrestrial frog, which is generally associated with forest habitats.
Anuran species identified as indicators of the sampled habitats along the urban-rural gradient in Tabatinga. Numbers are indicator values (Indval), and bold numbers highlight significant (*P < 0.05, **P < 0.01) values in the permutation tests.
Environmental variables
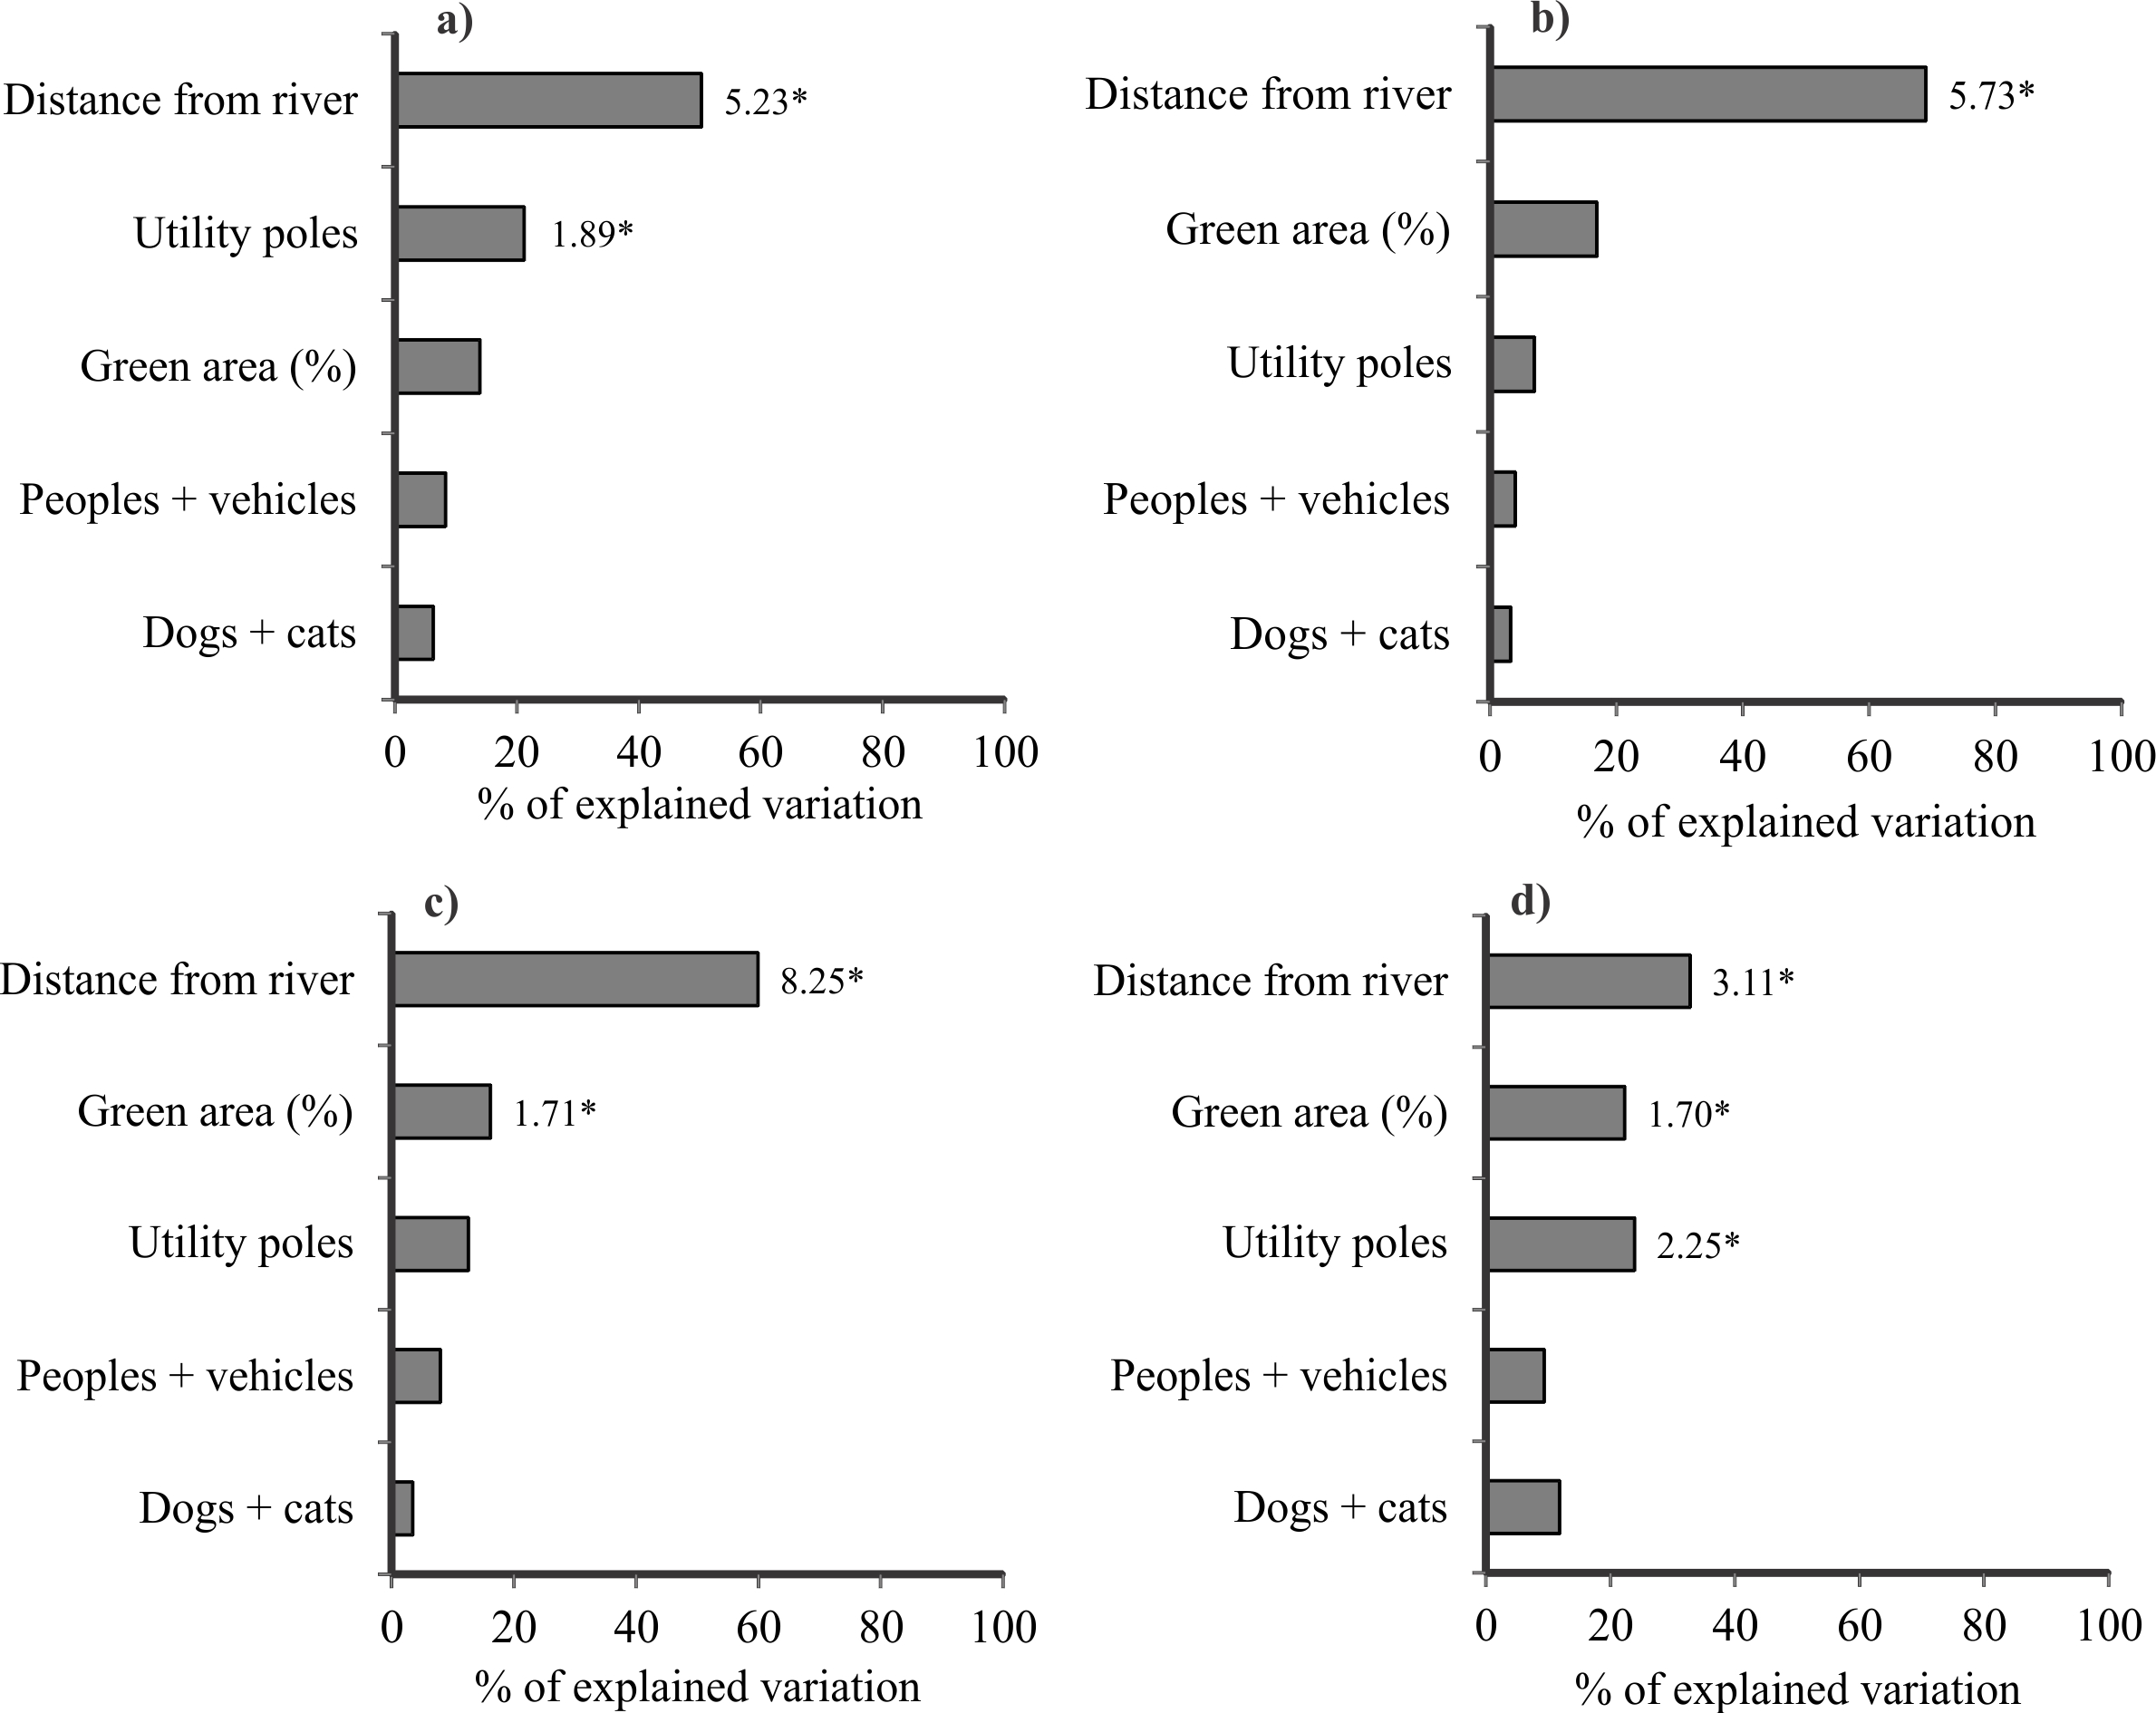
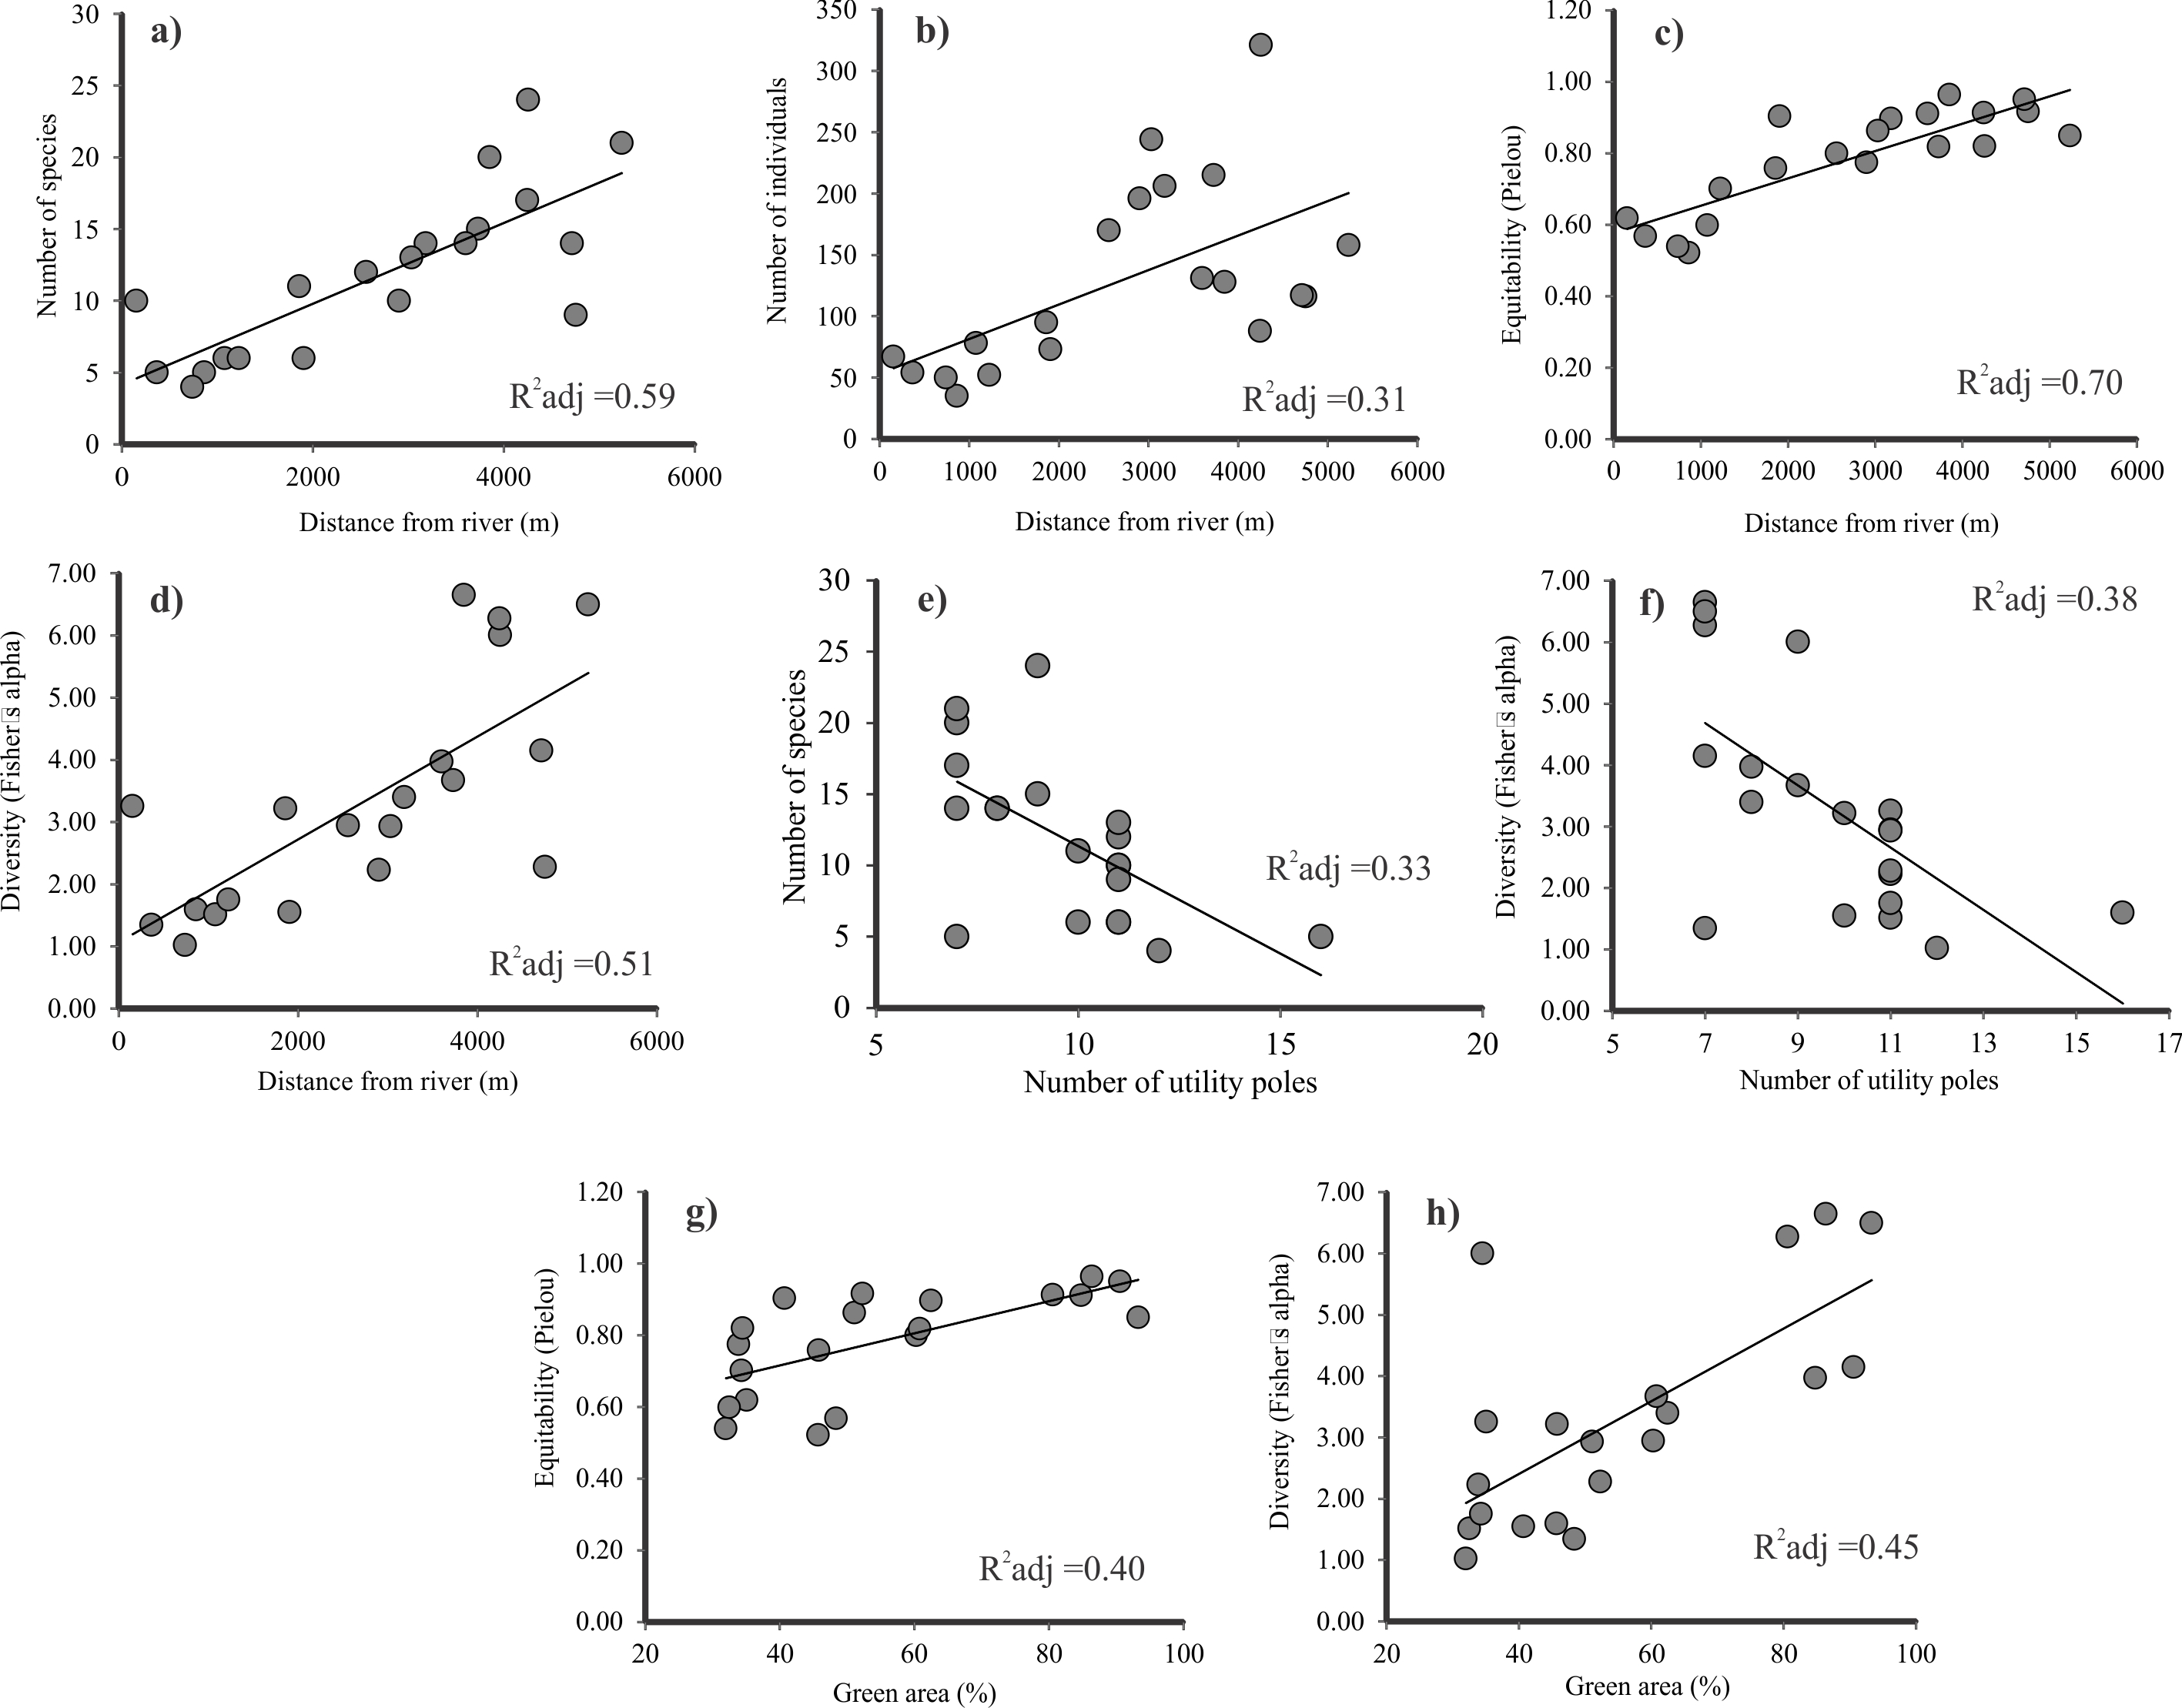
Distance from the river, percentage of green area, and the number of utility poles were the most influential variables for explaining variation in the diversity and abundance of the anurans (Figure 6). The abundance of people, vehicles and pets had little influence on the diversity patterns (Figure 6). As one moves away from the Solimões River, there is a substantial increase in species richness, abundance, equitability and diversity when measured with the Fisher indices (Figure 7a-d). Species richness and diversity are negatively affected by the increase in the number of utility poles (Figure 7e, f). Species equitability (Pielou indices) and diversity (Fisher indices) are positively affected by the percentage of green area (Figure 7g, h).
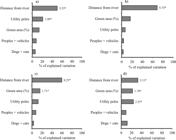
The proportional contribution of each urbanization variable to explain variation in anuran: a) species richness, b) Fisher’s alpha diversity, c) abundance (number of individuals counted) and d) equitability (Pielou index).
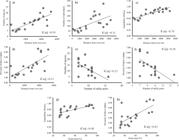
Regression lines indicate the effects of distance from the Solimões River (a-d), density of utility poles (e, f) and percentage of green area (g, h) in distinct measurements of anuran alpha diversity in Tabatinga.
DISCUSSION
Our study revealed significant variations in the taxonomic structure of anuran assemblages along the urban-rural gradient in Tabatinga. Urban areas hosted the lowest alpha diversity indicating a high degree of habitat disturbance. Anuran alpha diversity is significantly variable in urban-rural gradients in different parts of the world (Konowalik et al. 2020, Hutto & Barrett 2021, Ijie et al. 2021). For example, in rural and urban ponds of Campo Grande (Brazil) a total of 20 species of anurans were recorded, while in urban and rural forest fragments of Maringá and São Paulo (Brazil) the occurrence of 27 and 87 species, respectively, were documented (Lourenço-de-Moraes et al. 2018, Ganci et al. 2022). In Itacoatiara, in the Brazilian Amazon, Menin et al. (2019) recorded 19 and 29 anuran species in urban and rural habitats, respectively, which is similar species richness to what we found in Tabatinga.
The general pattern that emerges from these studies is the gradual loss of anuran species along the urban-rural gradient, as occurs in other taxonomic groups (Pillsbury & Miller 2008, McKinney 2008). However, the magnitude of the anuran species loss likely depends on differential sampling efforts, habitats/biomes studied, methods used to assess anuran diversity, and the biotic and abiotic attributes of the studied cities (McKinney 2008, Beninde et al. 2015).
Species richness is not the most appropriate measure of alpha diversity as it ignores the abundance distribution among species (Roswell et al. 2021). Indeed, Shannon and Simpson indices better differentiated the anuran alpha diversity between the studied environments. This indicates that species abundance data are useful for understanding variations in taxonomic diversity along environmental gradients. More urbanized parts of the gradient tend to be occupied by a few numerically dominant species, while in more peripheral parts of the city and rural habitats, the species abundance distribution is more equitable and similar to what is observed in less-disturbed environments.
Environmental variations in the gradient also affect the beta diversity of anurans. Beta diversity is a concept that integrates replacement (or turnover) and differences in the number of species, with nestedness being a particular case of the latter component (Podani & Schmera 2011, Legendre 2014). Quantitative analysis suggests that species replacement is high between environments. This pattern, however, is strongly affected by differences in relative abundance between species and not by their identities. Furthermore, the differences in the number of species follow a nested distribution, whereby sites with lower species richness are composed of subsets of species from sites with higher species richness (see also Oda et al. 2017, Lourenço-de-Moraes et al. 2018).
Nested distribution is expected to be a dominant component of beta diversity in cities due to the non-random loss of species along the urbanization gradient (Vallejos et al. 2016, Ficetola & De Bernardi 2004, Lourenço-de-Moraes et al. 2018, Almeida-Gomes et al. 2019). Nonetheless, variations in beta diversity may depend on specific ecological contexts. For example, Ganci et al. (2022) demonstrated that species turnover is the dominant component in anuran assemblages in rural and urban ponds in Campo Grande (Brazil). Urban assemblages can differ from rural ones if the loss of species is partially compensated by the colonization of the cities by a unique conjunct of species, including exotic ones or those coming from distinct faunal sources (Fragata et al. 2022). Thus, the dominant component of beta diversity along urban-rural gradients could be an outcome of complex events of extinction and colonization, which in turn may be dependent on the ecological and biogeographic context considered.
Several physical, demographic and environmental variables have been used to measure spatial gradients in urban contexts (Moll et al. 2019, Padilla & Sutherland 2019, Kaminski et al. 2021, Pillsbury & Miller 2008, Ganci et al. 2022). In our study, the anuran taxonomic diversity is influenced by the distance from the Solimões River, which is likely related to the length of time since urbanization, an important predictor of anuran species diversity (Gagné & Fahrig 2010, Lourenço-de-Moraes et al. 2018). Riverine cities in the Amazon basin tend to expand away from the course of large rivers, with older urbanized areas located closer to the riverbanks (Silva & Scudeller 2022). This directional process of urban sprawl influenced the diversity and abundance of anurans in Tabatinga, in which sites closer to the Solimões River have lower diversity and a high dominance of a few species. Moreover, distance from potential faunal sources could be relevant for explaining our results. Indeed, habitats created by rivers harbor distinct anuran assemblages and these species could be prone to colonizing urban habitats (Ramalho et al. 2016, Fonte et al. 2021, Menin et al. 2019, see also Fragata et al. 2022 for a non-anuran example).
The number of utility poles and amount of green area also helps to explain alpha diversity patterns. In these cases, sites with a high density of utility poles indicate regions with consolidated urbanization and a lower alpha diversity of anurans. The influence of the amount of green area in the anuran assemblages of Tabatinga has also been documented in cities of the other parts of the world (e.g., Hamer 2022). In Manaus, more diversified assemblages of anurans are found within the large forest fragments (Silva et al. 2011, Barros et al. 2018, Menin et al. 2022). Similarly, large ponds housed more anuran species in the urban and rural environments of Campo Grande (Ganci et al. 2022).
These results suggest that the amount of habitat that is suitable for anurans in urbanized contexts determines the alpha and beta diversity of anuran assemblages. Connection among habitat patches and the shape of habitat remnants could also affect the anuran distribution (Ficetola & De Bernardi 2004, Pillsbury & Miller 2008), but the effects of these landscape attributes on anuran assemblages in tropical cities remain poorly investigated.
Implications for conservation
The anuran diversity represented within cities in the Amazon, Atlantic Forest and Temperate Forest biomes, varied from 24% to 74% of the regional species pool (this study, Delaney et al. 2021, Silva et al. 2011, Lima et al. 2012, Barros et al. 2018, Lourenço-de-Moraes et al. 2018, Menin et al. 2022). These studies show that, despite the loss of species, the urban matrix can still harbor a diverse fauna of anurans in tropical and temperate cities. Therefore, amphibian conservation in degraded urban environments may still be relevant (Spotswood et al. 2021), but the challenges involved in protecting species in a dynamic and strongly modified environment are enormous.
The long-term persistence of anuran species in urban habitats deserves special attention in a world with urban expansion and global climate change (Souza et al. 2019, McDonald et al. 2020, Simkin et al. 2022). Our results indicate that the amount of green area has an important contribution to the diversity and abundance of anurans. Thus, protecting forest remnants and other habitat types (e.g., ponds) located within the cities and in their immediate surroundings can be an important strategy for the conservation of anurans (Donati et al. 2022).
Protected areas cover more than 50% of the Amazon basin, which is home to the greatest diversity of amphibians in the world (Jenkins et al. 2015, Josse et al. 2021). Opportunities for expanding this system, however, have become limited. In the Brazilian Amazon, there are 722 municipalities and most of them have a maximum of 100,000 inhabitants (Chein & Procópio 2022). Incentivizing the creation of officially protected areas in the urban planning of these small and medium-sized cities may be an important complement to the current system of large, protected areas in the Amazon (Josse et al. 2021).
It is also necessary that the local government adopts management measures to guarantee the long-term persistence of anuran assemblages within these urban protected areas such as improving breeding habitats, expanding connectivity between urban reserves and careful translocation of individuals for the maintenance of anuran populations (Germano & Bishop 2009, Donati et al. 2022). Long-term monitoring of amphibian assemblages is also necessary in order to be able to assess the effectiveness of these conservation initiatives.
Acknowledgements
This article results from the master’s dissertation developed by Weslei Valteran dos Santos under the guidance of Marcelo Menin in the Programa de Pós-graduação em Zoologia at the Universidade Federal do Amazonas (UFAM), which is supported by Coordenação de Aperfeiçoamento de Pessoal de Nível Superior (CAPES). This study was funded by Coordenação de Aperfeiçoamento de Pessoal de Nível Superior (CAPES) and Conselho Nacional de Desenvolvimento Científico e Tecnológico (CNPq). We appreciate the support from Universidade do Estado do Amazonas (UEA) and from Brazilian Army via the Comando de Fronteira Solimões (8th BIS). Sérgio Henrique Borges was supported by Fundação de Amparo à Pesquisa do Estado do Amazonas (FAPEAM) through the grant from Programa FAPEAM Produtividade em CT&I (call 013/2022). Fabricio Baccaro is continuously supported by a CNPq grant #312878/2023-0. We dedicate this paper to the vivid memory of our beloved friend and colleague Marcelo Menin. The authors have no relevant financial or non-financial interests to disclose.
References
- ALMEIDA-GOMES M, VIEIRA MV, ROCHA CFD & MELO AS. 2019. Habitat amount drives the functional diversity and nestedness of anuran communities in an Atlantic Forest fragmented landscape. Biotropica 51: 874-884.
- AVILA-PIRES TC ET AL. 2018. Changes in amphibian and reptile diversity over time in Parque Estadual do Utinga, a protected area surrounded by urbanization. Herpet Notes 11: 499-512.
- BAKER BJ & RICHARDSON JML. 2006. The effect of artificial light on male breeding season behavior in green frogs, Rana clamitans melanota Can J Zool 84: 1528-1532.
- BARROS AL, OLIVEIRA G, PANTOJA J, TAVEIRA R & SILVA-FORSBERG MC. 2018. Composition, temporal distribution and vocalization microhabitats of frogs at Sumaúma State Park, Manaus, Amazonas, Brazil. Herpet Notes 11: 311-318.
- BASELGA A. 2010. Partitioning the turnover and nestedness components of beta diversity. Glob Ecol Biogeogr 19: 134-143.
- BEE MA & SWANSON EM. 2007. Auditory masking of anuran advertisement calls by road traffic noise. Anim Behav 74: 1765-1776.
- BENINDE J, VEITH M & HOCHKIRCH A. 2015. Biodiversity in cities needs space: a meta-analysis of factors determining intra-urban biodiversity variation. Ecol Lett 18: 581-592.
- CHAO A, GOTELLI NJ, HSIEH TC, SANDER EL, MA KH, COLWELL RK & ELLISON AM. 2014. Rarefaction and extrapolation with Hill numbers: a framework for sampling and estimation in species diversity studies. Ecol Monogr 84: 45-67.
- CHEIN F & PROCÓPIO IV. 2022. As cidades na Amazônia Legal: diagnóstico, desafios e oportunidades para urbanização sustentável. Centro de Empreendedorismo da Amazônia, 119 p.
- CLARKE KR & WARWICK RM. 2001. Change in marine communities: an approach to statistical analysis and interpretation, 2nd ed., Plymouth: PRIMER-E, 176 p.
- CLERGEAU P, JOKIMÄKI J & SAVARD JPL. 2001. Are urban bird communities influenced by the bird diversity of adjacent landscapes? J Appl Ecol 38: 1122-1134.
- COLWELL RK, CHAO A, GOTELLI NJ, LIN SY, MAO CX, CHAZDON RL & LONGINO JT. 2012. Models and estimators linking individual-based and sample-based rarefaction, extrapolation and comparison of assemblages. J Plant Ecol 5: 3-21.
- CORDIER JM, AGUILAR R, LESCANO JN, LEYNAUD GC, BONINO A, MILOCH D, LOYOLA R & NORI J. 2021. A global assessment of amphibian and reptile responses to land-use changes. Biol Conserv 253: 108863.
- CUSHMAN SA. 2006. Effects of habitat loss and fragmentation on amphibians: a review and prospectus. Biol Conserv 128: 231-240.
- DELANEY KS, BUSTEED G, FISHER RN & RILEY SP. 2021. Reptile and amphibian diversity and abundance in an urban landscape: impacts of fragmentation and the conservation value of small patches. Ichthyol Herpetol 109: 424-435.
- DONATI GF, BOLLIGER J, PSOMAS A, MAURER M & BACH PM. 2022. Reconciling cities with nature: Identifying local Blue-Green Infrastructure interventions for regional biodiversity enhancement. J Environ Manag 316: 115254.
- DUELLMAN WE. 2005. Cusco Amazónico: the lives of anurans and reptiles in an Amazonia rainforest. Cornell University Press, Ithaca and London, 433 p.
- DUFRÊNE M & LEGENDRE P. 1997. Species assemblages and indicator species: the need for a flexible asymmetrical approach. Ecol Monogr 67: 345-366.
- FICETOLA GF & DE BERNARDI F. 2004. Anurans in a human-dominated landscape: the community structure is related to habitat features and isolation. Biol Conserv 119: 219-230.
- FONTANA CS, BURGER MI & MAGNUSSON WE. 2011. Bird diversity in a subtropical South American City: effects of noise levels, arborisation and human population density. Urban Ecosyst 14: 341-360.
- FONTE LFMD, LATOMBE G, GORDO M, MENIN M, DE ALMEIDA AP, HUI C & LÖTTERS S. 2021. Amphibian diversity in the Amazonian floating meadows: a Hanski core-satellite species system. Ecography 44: 1325-1340.
- FRAGATA M, BACCARO F, GONÇALVES ALS & BORGES SH. 2022. Living in a tropical concrete jungle: diversity and abundance variation in a parrot assemblage (Aves, Psittacidae) of a major Amazonian city. Urban Ecosyst 25: 977-987.
-
FROST DR. 2023. Amphibian Species of the World: An Online Reference. Version 6.0. Electronic Database accessible at: https://amphibiansoftheworld.amnh.org/index.php American Museum of Natural History, New York, USA. Acessed on 04 June, 2024.
» https://amphibiansoftheworld.amnh.org/index.php - GAGNÉ SA & FAHRIG L. 2010. Effects of time since urbanization on anuran community composition in remnant urban ponds. Environ Conserv 37: 128-135.
- GANCI CC, PROVETE DB, PÜTTKER T, LINDENMAYER D & ALMEIDA-GOMES M. 2022. High species turnover shapes anuran community composition in ponds along an urban-rural gradient. Urban Ecosyst 25: 633-642.
- GERMANO JM & BISHOP PJ. 2009. Suitability of amphibians and reptiles for translocation. Conserv Biol 23: 7-15.
- GODINHO MBC & SILVA FR. 2018. The influence of riverine barriers, climate, and topography on the biogeographic regionalization of Amazonian anurans. Sci Rep 8: 3427.
- GONZÁLEZ-CÉSPED C, ALANIZ AJ, VERGARA PM, CHIAPPA E, ZAMORANO J & MANDUJANO V. 2021. Effects of urban environmental conditions and landscape structure on taxonomic and functional groups of insects. Urban For Urban Green 58: 126902.
- HAMER AJ. 2022. A multi-scale, multi-species approach highlights the importance of urban green space and pond design for amphibian communities. Urban Ecosyst 25: 393-409.
- HAMER AJ & MCDONNELL MJ. 2008. Anuran ecology and conservation in the urbanizing world: a review. Biol Conserv 141: 2432–2449.
- HAMMER Ø, HARPER DA & RYAN PD. 2001. Past: paleontological statistics software package for education and data analysis. Palaeontol Electron 4: 1.
- HEYER WR, MCDIARMID RW, DONNELLY MA, HAYEK LC & FOSTER M. 1994. Measuring and Monitoring Biological Diversity: Standard Methods for Anurans. Smithsonian Institution Press, Washington, DC, 364 p.
- HOPE D, GRIES C, ZHU W, FAGAN WF, REDMAN CL, GRIMM NB, NELSON AL, MARTIN C & KINZIG A. 2003. Socioeconomics drive urban plant diversity. Proc Natl Acad Sci 100: 8788-8792.
- HUTTO JR D & BARRETT K. 2021. Do urban open spaces provide refugia for frogs in urban environments? PLoS ONE 16: e0244932.
- IJIE ME, ALARI EO, OGOANAH SO & AISIEN MSO. 2021. Amphibian diversity in urban and peri-urban landscapes of Benin City, a Southern Nigerian City in the rainforest biotope. Zoologist (The) 19: 52-59.
- JENKINS CN, ALVES MAS, UEZU A & VALE MM. 2015. Patterns of Vertebrate Diversity and Protection in Brazil. PLoS ONE 10(12): e0145064.
- JOSSE C, FUTADA SM, VON HILDEBRAND M, DE LOS RIOS MM, OLIVEIRA-MIRANDA MA, MORAES ENS, TUESTA E. 2021. Chapter 16: The state of conservation policies, protected areas, and Indigenous territories, from the past to the present. In: Nobre C et al. (Eds), Amazon Assessment Report 2021. United Nations Sustainable Development Solutions Network, New York, USA.
- KAMINSKI A, BAUER DM, BELL KP, LOFTIN CS & NELSON EJ. 2021. Using landscape metrics to characterize towns along an urban-rural gradient. Landsc Ecol 36: 2937-2956.
- KONOWALIK A, NAJBAR A, KONOWALIK K, DYLEWSKI Ł, FRYDLEWICZ M, KISIEL P, STARZECKA A, ZALEŚNA A & KOLENDA K. 2020. Amphibians in an urban environment: a case study from a central European city (Wrocław, Poland). Urban Ecosyst 23: 235-243.
- LAMBSHEAD PJD, PLATT HM & SHAW KM. 1983. The detection of differences among assemblages of marine benthic species based on an assessment of dominance and diversity. J Nat Hist 17: 859-874.
- LEGENDRE P. 2014. Interpreting the replacement and richness difference components of beta diversity. Glob Ecol Biogeogr 23: 1324-1334.
- LEHTINEN RM, GALATOWITSCH SM & TESTER JR. 1999. Consequences of habitat loss and fragmentation for wetland anuran assemblages. Wetlands 19: 1-12.
- LENNON JJ, KOLEFF P, GREENWOOD JJD & GASTON KJ. 2001. The geographical structure of British bird distributions: diversity, spatial turnover and scale. J Animal Ecol 70: 966-979.
- LIMA AP, MAGNUSSON WE, MENIN M, ERDTMANN LK, RODRIGUES DJ, KELLER C & HÖDL W. 2012. Guia de Sapos da Reserva Adolpho Ducke, Amazônia Central / Guide to the Frogs of the Reserva Adolpho Ducke, Central Amazonia. 2nd ed., Manaus: INPA, 168 p.
- LOURENÇO-DE-MORAES R, MALAGOLI LR & GUERRA V. 2018. Nesting patterns among Neotropical species assemblages: can reserves in urban areas be failing to protect anurans? Urban Ecosyst 21: 933-942.
- LUCK GW, SMALLBONE LT & SHEFFIELD KJ. 2013. Environmental and socio-economic factors related to urban bird communities. Austral Ecol 38: 111-120.
- MAC NALLY R. 2000. Regression and model-building in conservation biology, biogeography and ecology: the distinction between – and reconciliation of – ‘predictive’ and ‘explanatory’ models. Biodivers Conserv 9: 655-671.
- MACGREGOR-FORS I & SCHONDUBE JE. 2011. Gray vs. green urbanization: Relative importance of urban features for urban bird communities. Basic Appl Ecol 12: 372-381.
- MATTHEWS TJ & WHITTAKER RJ. 2015. On the species abundance distribution in applied ecology and biodiversity management. J Appl Ecol 52: 443-454.
- MCDONALD RI ET AL. 2020. Research gaps in knowledge of the impact of urban growth on biodiversity. Nat Sustain 3: 16-24.
- MCDONNELL MJ, PICKETT STA, GROFFMAN P, BOHLEN P, POUYAT RV, ZIPPERER WC, PARMELEE RW, CARREIRO MM & MEDLEY K. 1997. Ecosystem processes along an urban-to-rural gradient. Urban Ecosyst 1: 21-36.
- MCKINNEY ML. 2002. Urbanization, biodiversity, and conservation. Bioscience 52: 883-890.
- MCKINNEY ML. 2006. Urbanization as a major cause of biotic homogenization. Biol Conserv 127: 247-260.
- MCKINNEY ML. 2008. Effects of urbanization on species richness: A review of plants and animals. Urban Ecosyst 11: 161-167.
- MENIN M, FERREIRA RB, MELO IB, GORDO M, HATTORI GY & SANT’ANNA BS. 2019. Anuran diversity in urban and rural zones of the Itacoatiara municipality, central Amazonia, Brazil. Acta Amazon 49: 122-130.
- MENIN M, GORDO M, KAEFER I & OLIVEIRA ME. 2022. Sapos, rãs e pererecas. In: Monteiro CG, Oliveira EC & Silveira EB (Eds), Fauna & Flora do Campus da Universidade Federal do Amazonas: a maior biodiversidade urbana do Brasil, Editora da Universidade Federal do Amazonas, Manaus, p. 193-206.
- MOLL RJ, CEPEK JD, LORCH PD, DENNIS PM, TANS E, ROBISON T, MILLSPAUGH JJ & MONTGOMERY RA. 2019. What does urbanization actually mean? A framework for urban metrics in wildlife research. J Appl Ecol 56: 1289-1300.
- ODA FH, GONÇALVES S, ODA TM, TSCHOPE LCR, BRISO ALF, OLIVEIRA MRF, TAKEMOTO RM & VASCONCELOS TS. 2017. Influence of vegetation heterogeneity and landscape characteristics on anuran species composition in aquatic habitats along an urban-rural gradient in southeastern Brazil. Zool Ecol 27: 1-10.
- PADILLA BJ & SUTHERLAND C. 2019. A framework for transparent quantification of urban landscape gradients. Landsc Ecol 34: 1219-1229.
- PILLSBURY FC & MILLER JR. 2008. Habitat and landscape characteristics underlying anuran community structure along an urban-rural gradient. Ecol Appl 18: 1107-1118.
- PODANI J. 2001. SYN-TAX 2000. Computer programs for data analysis in ecology and systematics. Budapest: Scientia Publishing.
- PODANI J & SCHMERA D. 2011. A new conceptual and methodological framework for exploring and explaining pattern in presence-absence data. Oikos 120: 1625-1638.
- RADELOFF VC, HAMMER RB & STEWART SI. 2005. Rural and suburban sprawl in the US Midwest from 1940 to 2000 and its relation to forest fragmentation. Conserv Biol 19: 793-805.
- RAMALHO WP, ANDRADE MS, MATOS LRA & VIEIRA LJS. 2016. Amphibians of varzea environments and floating meadows of the oxbow lakes of the Middle Purus River, Amazonas, Brazil. Biota Neotrop 16: e20150093.
- RODRÍGUEZ L & DUELLMAN WE. 1994. Guide to the frogs of the Iquitos region, Amazonian Peru. University of Kansas Special Publications 22: 1-80.
- ROSWELL M, DUSHOFF J & WINFREE R. 2021. A conceptual guide to measuring species diversity. Oikos 130: 321-338.
- SAITO M & KOIKE F. 2013. Distribution of wild mammal assemblages along an urban–rural-forest landscape gradient in warm-temperate East Asia. PLoS ONE 8: e65464.
- SAITO MU & KOIKE F. 2015. Trait-dependent changes in assemblages of mid-sized and large mammals along an Asian urban gradient. Acta Oecol 67: 34-39.
- SILVA EP, MENDES-PINTO TJ, JÚNIOR LHC & SALES MEP. 2011. Riqueza de espécies de anfíbios anuros em um fragmento florestal na área urbana de Manaus, Amazonas, Brasil. Revista de Biologia e Farmácia 5: 131-144.
- SILVA JRC & SCUDELLER VV. 2022. Os ciclos econômicos da borracha e a Zona Franca de Manaus: expansão urbana e degradação das microbacias. Res Soc Dev 11: e33611629103-e33611629103.
- SIMKIN RD, SETO KC, MCDONALD RI & JETZ W. 2022. Biodiversity impacts and conservation implications of urban land expansion projected to 2050. Proc Natl Acad Sci U S A 119: e2117297119.
- SMALLBONE LT, LUCK GW & WASSENS S. 2011. Anuran species in urban landscapes: Relationships with biophysical, built environment and socio-economic factors. Landsc Urban Plann 101: 43-51.
- SOUZA KS, JARDIM L, RODRIGUES F, BATISTA MCG, RANGEL TF, GOUVEIA S, TERRIBILE LC, RIBEIRO MSL, FORTUNATO DS & DINIZ-FILHO JAF. 2019. How likely are adaptive responses to mitigate the threats of climate change for amphibians globally? Front Biogeogr 11(3): e43511.
- SPOTSWOOD EN, BELLER EE, GROSSINGER R, GRENIER JL, HELLER NE & ARONSON MF. 2021. The biological deserts fallacy: cities in their landscapes contribute more than we think to regional biodiversity. Bioscience 71: 148-160.
- VACHER JP ET AL. 2020. Large-scale DNA-based survey of frogs in Amazonia suggests a vast underestimation of species richness and endemism. J Biogeogr 47: 1781-1791.
- VALLEJOS MA, PADIAL AA & VITULE JRS. 2016. Human-induced landscape changes homogenize Atlantic Forest bird assemblages through nested species loss. PLoS ONE 11: e0147058.
- YANG L, ZHAO S & LIU S. 2022. A global analysis of urbanization effects on amphibian richness: Patterns and drivers. Global Environ Change 73: 102476.
- ZHANG W, LI B, SHU X, PEI E, YUAN X, SUN Y, WANG T & WANG Z. 2016. Responses of anuran communities to rapid urban growth in Shanghai, China. Urban For Urban Gree 20: 365-374.
Edited by
-
Handling editor
Vasco Azevedo
The datasets analyzed in this study are available in the form of Supplementary Material (Table SI).