 Mathematical model for the measurement of the uniformity on equestrian surfaces
ABSTRACT:
The uniformity of the mechanical properties of equestrian surfaces influences equine biomechanics, however, its quantification requires a standardized equation to increase the precision of mathematical modeling. Thus, the objective was to develop a model for measuring the uniformity of equestrian surfaces (UNF). For this, four equestrian surfaces were analyzed for hardness, moisture, grip, depth, topography and corrective maintenance. To quantify uniformity, the UNF model was proposed using statistical modeling based on significant comparisons (P < 0.05), Hierarchical Cluster Grouping and Principal Component Analysis to measure uniformity, considering the relationship between mechanical properties. Surface III presented the lowest uniformity (38.03%) when compared to the others (I = 68.14%); II = 64.51%; IV = 72.01%), thus, the UNF model has the capacity to measure the uniformity of equestrian surfaces, identifying the properties responsible for the variation found on each surface.
Key words:
mechanical properties; performance; precision animal science
RESUMO:
A uniformidade das propriedades mecânicas de superfícies equestres influencia a biomecânica equina, entretanto, sua quantificação necessita de uma equação padronizada para aumentar a precisão da modelagem matemática. Nesse sentido, este estudo objetivou o desenvolvimento de um modelo para mensuração da uniformidade de superfícies equestres (UNF). Para isso, quatro superfícies equestres foram analisadas por meio da dureza, umidade, aderência, profundidade, topografia e manutenção corretiva. Para quantificação da uniformidade foi proposto o modelo UNF utilizando modelagem estatística a partir de comparações significativas (P < 0.05), Agrupamento Hierárquico de Cluster e Análise de Componentes Principais para mensuração da uniformidade, considerando relação entre as propriedades mecânicas. Os resultados mostraram que a superfície III apresentou a menor uniformidade (38,03%) quando comparada às demais (I = 68,14%); II = 64,51%; IV = 72,01%), assim, o modelo UNF possui capacidade de mensuração da uniformidade de superfícies equestres, identificando as propriedades responsáveis pela variação encontrada em cada superfície.
Palavras-chave:
propriedades mecânicas; performance; zootecnia de precisão
INTRODUCTION
The mechanical behavior of equestrian surfaces is constantly analyzed through mechanical properties, as they have an effect on equine biomechanics, rate of orthopedic injuries, athletic performance and animal welfare by investigating the horse-hoof-surface interaction (PETERSON et al., 2008; SETTERBO et al., 2009; SYMONS et al., 2013; HOBBS et al., 2014; SYMONS et al., 2015; NORTHROP et al., 2020; GRAYDON et al., 2023; PIZZI et al., 2024; SOUZA et al., 2024; KOWALSKI et al., 2025). Uniformity consists of the similarity between the mechanical behavior of mechanical properties at different locations on the surface, resulting from the complex and multifactorial relationship of hardness, moisture, shear resistance (grip), depth and topographic dip (HOBBS et al., 2014).
There are disagreements about the ideal performance of surfaces in the athletic performance and safety of animals; however, monitoring uniformity is a consensus in equestrian disciplines, as the deleterious effects of the lack of this parameter on equine biomechanics have already been described (CHATEAU et al., 2009). The dynamics of surfaces can be analyzed by hardness, shear strength, moisture, depth, topography, construction system, composition and uniformity (NIGG & YEADON, 1987; ORLANDE et al., 2012; PETERSON & MCILWRAITH, 2008; ROHLF et al., 2023a; 2023b). In this context, uniformity is extremely important to maintain the regularity of mechanical properties and their biomechanical effects, since surfaces with low uniformity do not provide a safe environment for carrying out equestrian sports activities, due to the kinesiological oscillations caused to the musculoskeletal system of horses (HOBBS et al., 2014; PARKES & WITTE, 2015).
The quantification of this property proposes to guarantee locomotion efficiency, due to horses having musculoskeletal limitations in adapting to surfaces with low uniformity, where even changing their gait in compensation, the animal’s balance will be challenged by the mechanical fluctuations of the surface, increasing the loads on the locomotor system and generating irregular gaits (MARTIN, 2007; NORTHROP et al., 2016). These aspects make a specific numerical approach essential for measuring this property, as it represents the set of dynamic surface interactions, with the usual methods being restricted to the interpretation of standardized statistical techniques.
Current methods for measuring uniformity through averaging the coefficient of variation of the properties, comparing data between specific areas of the surface, regression, multivariate analysis by Cluster grouping and Principal Component Analysis (NORTHROP et al., 2016; HERNLUND et al., 2017; BLANCO et al., 2021), are effective in identifying mechanical variation but fall short of providing a unified numerical measure of uniformity. To address this gap, the present study introduces the UNF model, a novel mathematical framework designed to quantitatively integrate these established statistical approaches.
The model synthesizes results from significant comparisons, Hierarchical Cluster Grouping, and Principal Component Analysis into a single uniformity index, effectively translating complex multivariate relationships into an interpretable percentage. In accordance with the present demand, the objective of this study was the development of a mathematical model to measure the uniformity of equestrian surfaces.
MATERIALS AND METHODS
The present study was carried out in four equestrian training centers (I, II, III and IV) in Rio Grande do Sul - Brazil, in the cities of Pelotas, Capão do Leão and Jaguarão from November 2022 to February 2023. Coordinates are preserved due to the commercial impact of the study.
Experimental design
The equestrian surfaces (I, II, III and IV) were characterized according to construction system, corrective maintenance and composition (Table 1) to define the effects present in each experimental area. (WHEELER & ZAJACZKOWSKI, 2006). Thus, all surfaces were arranged in an Outdoor system with no drainage system, surface composition based on sand, silt and clay and three had a built structural base (I, II and III). Surfaces I, II and IV were subjected to corrective maintenance with mechanical rakes measuring vertical cuts between three and six centimeters deep before testing. No corrective maintenance was carried out on surface III, with traffic greater than 60 horses per week in a training regime of four to five hours per week.
The tests were carried out on different days under constant climatic conditions of temperature (27.61 ± 6.66 ºC) (4-1 electronic soil meter) and relative air humidity (72.29 ± 4.88%) (INMET, 2023), and after a seven-day rain-free period to ensure surface moisture levels corresponded to the surface water retention capacity. The experimental surfaces were selected to test the uniform model (UNF) in different dimensions and corrective maintenance of the surfaces.
Testing points
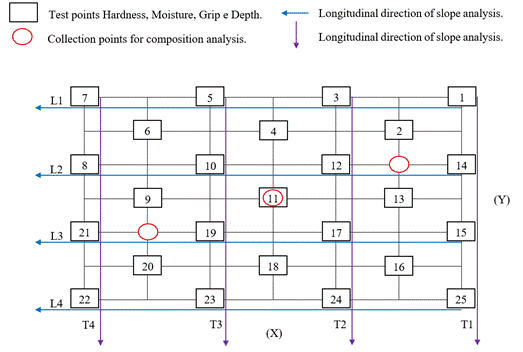
The determination of test points and sample collection occurred according to the methodology adapted from NORTHROP et al. (2016). For this, the total surface area was divided into 36 quadrants covering 25 points (1 m2 per point) for surface testing and three collection points to measure composition (Figure 1). A limit of one to two meters was respected between the lateral points and the surface containment barriers (ends) to remove the edge effect. All tests (Hardness, Moisture, Grip, Depth and Temperature) were carried out in three repetitions spaced 20 centimeters apart at each testing point.

Testing points for mechanical properties on equestrian surfaces and direction of slope analysis.
Surface composition analysis
The collection of material from surfaces (Figure 1) for laboratory analysis was carried out in accordance with the DNER-PRO 003/94 (1994) standard for deformed samples. The material was collected in an area of 0.5 m2 at each point, using a mechanical auger and stored in plastic bags.
Granulometric analysis
Granulometric analysis was carried out using the Bouyoucos hydrometer method (1962) to identify the composition of the surfaces in sand (2 mm - 0.05), silt (0.05 - 0.002 mm) and clay (< 0.002 mm) (TEIXEIRA et al., 2017). For this, the samples were subjected to manual fragmentation, dried and sieved, counting retained material (2 mm) and 40 grams of the collected material being removed to determine the particle size fractions. The samples were dried in an oven at 105 ºC to determine the dry matter and then 1M sodium hydroxide was added and left to rest for 24 hours, crushing was carried out and the density and temperature were measured two hours after the start of sedimentation in beakers (1000 ml) for reading of the amount of clay and finally the material was washed in a sieve (0.05) and dry matter was added again. The results are obtained through the difference in initial and final mass for sand (%), density and temperature reading for clay (%) and silt (%) by the difference between sand and clay (100 - sand - clay).
Determination of organic carbon
Organic carbon was determined using the Walkley-Black method (TEIXEIRA et al., 2017) through the oxidation of organic carbon to carbon dioxide by chromic acid, arising from the reaction between potassium dichromate and sulfuric acid in contact with the samples. The results were obtained by titration with ferrous sulfate, determining the excess of potassium dichromate after carbon oxidation.
Hardness
Hardness was measured using a digital compaction meter (FALKER - Model PenetroLOG - PLG1020) with the ability to break the surface structure under constant speed (30 - 50 mm/s) up to a height of 5 cm, with a resolution of 0.01 meters.
Shear strength (Grip)
Shear strength was obtained using an adapted functional traction device (PEHAM & SCHRAMEL, 2017), measuring peak torque (Nm) in 90º rotation of a horseshoe test body (JK Plus Nº2) applying a force of 800 Newtons (80 kg) on the surface and using a digital torque wrench (Lianai ES3-060N).
Depth
The depth of the surface (cm) was measured with the aid of a metric rod (1 mm in diameter), capable of breaking the surface layer that makes up the surface structure up to the foundation limit (NORTHROP et al., 2016).
Moisture analysis
Moisture was measured with the aid of a TDR sensor (Field Scout - Model TDR-100; Spectrum Technologies), performing measurements in triplicates at a depth of 0 - 7.6 cm and the results expressed as a percentage (BLANCO et al., 2021). Time domain reflectometry (TDR) is widely used to test (%) volumetric water content.
Topographic analysis
The topographic survey took place according to methodology adapted from BRUCH et al., (2019). Thus, for planialtimemetric correction of the geodetic positions of the aerial survey images, 12 control points tracked in the field were used, through a pair of Global Navigation Satellite System - GNSS receivers with reception of corrections in real time (Real Time Kinematic-RTK). The receivers used are from the Emlid brand, Reach RS2 model, L1/L2 band and multi-constellation (GPS, GLONASS, BeiDou and Galileu). After the field survey, the Base’s positioning record was compressed and sent for post-processing, aiming to correct errors through the Precise Point Positioning (PPP) system of the Brazilian Institute of Geography and Statistics (IBGE). The geodetic reference system used was SIRGAS 2000 and the Projection is the Universal Transverse of Mercator in its Zone 22 south. After processing in PPP-IBGE, data from control points were translated by subtracting positional discrepancies. The accuracy achieved with this methodology is 1.7 mm.
Photogrammetric aerial survey with UAV
The photogrammetric aerial surveys were carried out using a rotary-wing Unmanned Aerial Vehicle (UAV) (Phantom 4 Advanced - DJI). To increase survey accuracy and control image acquisition parameters, mainly maintaining the frontal and lateral overlap rate, height and flight speed, a flight plan was created using the free DroneDeploy program. The overlap rates were 70%, the flight height was 40 meters from the highest altitude on the ground, at an average speed of 4 meters/Second.
Photogrammetric processing
After carrying out the aerial surveys, the images were saved in the Joint Photographic Experts Group (JPEG) format with GEOTAG metadata. The MetaShape Professional program (Agisoft) was used to process the aerial images, as proposed by JAUD et al. (2016). MetaShape is an evolution of its precursor, the PhotoScan program; both allow the creation of orthomosaics with high spatial resolution through the mosaic creation technique based on the similarities between stereoscopic imagesNext, the homologous point cloud was generated and the Digital Surface Model (MDS) was constructed. To generate these products, MetaShape uses multiview technology, which allowed the processing of arbitrary images, with overlapping variations, as long as there were homologous points in different images (BRUCH et al., 2019).
Topographic slope (Acclivity and Declivity)
To generate topographic profiles, GIS Quantum GIS (Qgis 3.4.3) was used. Topographic slope consists of the relationship between the difference in depth between two points and the horizontal distance between them, resulting in a percentage from zero to infinity. According to VALERIANO & ROSSETTI (2011), the calculation of the dip is the result of the first derivative of the elevation in relation to the horizontal distance. The calculation was carried out by the vertical distance divided by the horizontal distance and multiplied by 100). The slope (%) was measured considering two spatial orientations following collection points (Figure 1) as a reference for determining the longitudinal (X) and transversal (Y) orientation, carried out with four repetitions. In the longitudinal method, the measurement direction was L1 (Point 1 to 7), L2 (Point 14 to 8), L3 (Point 15 to 22) and L4 (Point 25 to 22) and in the transverse method T1 (Point 1 to 25), T2 (Point 3 to 24), T3 (Point 5 to 23) and T4 (Point 7 to 22).
The unified spatial mechanical variation of the properties of each surface was obtained by considering the geometric arrangement of each location through the distribution of test points (Figure 1) and illustrated in figure 2, using contour maps. For its generation, the Surfer software (Surfer version 10.2.601) (GOLDEN SOFTWARE, 2011) was used, where the cartographic variations correspond to the median of all properties (Hardness, Moisture, Grip and Depth) which were standardized to remove the effect of the unit of measurement (Mean 0 and standard deviation 1).

Unified variation of the mechanical behavior of each equestrian surface through the use of standardized data without a unit of measurement.
Mathematical model for measurement of uniformity
The mathematical modeling to measure the uniformity of equestrian surfaces was based on the analytical methodology proposed by NORTHROP et al. (2016) and SCHMITT et al. (2023) through Cluster Grouping and Principal Component Analysis. Therefore, we use the K25 method to compare test points, Cluster Grouping for differences not found by K25 and Main Components to calculate the specific effect of variables.
The proposed model (UNF) considers for modeling the number of multiple comparisons with significant difference (P < 0.05) from the K25 and Cluster method, applying the rotated coefficients of the Main Components (PC1 and PC2) and total explained variation to numerically quantify the effect of each mechanical property. Uniformity is calculated as a percentage separately between the K25 and Cluster methods, as well as for each property (Hardness, Moisture, Grip and Depth) and the average is then taken between the methods and mechanical properties. The two largest coefficients retained per main component were used, when more than one component was identified. The equation that forms the UNF model is arranged as follows:
where:
UNF: Corresponds to the uniformity of each mechanical property;
Ev: Total variation explained by the main components (%);
Cp: Decimal number of multiple comparisons with statistical difference (P < 0.05);
Kpca: Coefficient used from the main components (%) (PC1 or PC2);
Ncomp: Number of coefficients retained in the main component (PC1 or PC2);
Cm: Total number of significant comparisons;
Ex: Percentage (%) explained by the main component (PC1 or PC2);
Statistical analysis
The results obtained in this study include comparison using the Kruskal-Wallis non-parametric data test (P < 0.05) for the K25 method and the Hierarchical Cluster, which grouped the data using the Ward method considering the Euclidean distance measure. Principal component analysis was used to weight the influence of each mechanical property by the generated coefficients and total variation explained and the coefficients were rotated using the Varimax with Kaiser normalization method. The raw data were transformed to mean zero and standard deviation one to remove the effect of different measurement units for Cluster grouping and Principal Component Analysis. For the K25 comparisons, three repetitions per analysis point were used for each variable (N = 25), while for the hierarchical clustering and Principal Component Analysis, each measure was considered as a repetition (N = 75). The results of the topographic dive and comparison of uniformity between surfaces (I, II, III and IV) were subjected to normality analysis by Shapiro Wilki, homogeneity of variance by Barlet and means compared by the Tukey test (P < 0.05). The data were analyzed using R Statistic (4.2.1) and IBM SPSS Statistics 20 software. The UNF model presents results in percentage (%) from the K25, Cluster Grouping, significant comparisons and Principal Component Analysis methods. The comparison of surfaces uniformity was performed considering K25 uniformity, cluster uniformity, and total variation explained by principal components as repetitions. All data used in this study are presented in their entirety without removing outliers, with variations considered intrinsic to the methods used.
RESULTS
Experimental surface I (Table 2) showed a statistical difference (P < 0.05) using the K25 method and Hierarchical Cluster Grouping for hardness, moisture, grip and depth, with significant comparison variations. The total variation explained was 71.63% by two main components (PC1 and PC2), moisture (0.857) and grip (0.853) being retained in PC1, explaining 36.87% of the variation and 34.76% explained by PC2 composed of hardness (-0.828) and depth (0.836). The UNF model resulted in 66.41% surface uniformity.
For experimental surface II (Table 3) presented statistical difference (P < 0.05) by the K25 method and Hierarchical Cluster Grouping for hardness, moisture, grip and depth, with significant comparison variations. The total variation explained was 66.44% by two main components (PC1 and PC2), with PC1 retaining moisture (0.824) and depth (-0.815) explaining 33.68% of the variation and 32.75% explained by PC2 composed of hardness (0.734) and grip (0.690). The UNF model resulted in 63.45% surface uniformity.
The results of experimental surface III (Table 4) demonstrated statistical difference (P<0.05) for hardness, moisture, grip and depth by the K25 method and Hierarchical Cluster Grouping, with significant comparison variations. The total variation explained was 44.26% by a main component (PC1), composed of hardness (0.528), moisture (0.446), grip (0.696) and depth (-0.899). The UNF model resulted in 34.92% surface uniformity.
On the experimental surface IV (Table 5) there was a statistical difference (P < 0.05) by the K25 method and Hierarchical Cluster Grouping for hardness, moisture, grip and depth, with significant comparison variations. The total variation explained was 75.69% by two main components (PC1 and PC2), with PC1 being hardness (0.861) and depth (-0.886) explaining 47.07% of the variation and 28.61% explained by PC2 composed of moisture (0.594) and grip (0.886). The UNF model resulted in 70.17% surface uniformity.
For the altimetric uniformity of the experimental surfaces (I, II, III and IV) measured by the photogrammetric aerial survey method (Table 6), there were differences (P < 0.05) between the measurement areas in the longitudinal orientation (L1, L2, L3 and L4) and transversal (T1, T2, T3 and T4) on each surface. Areas with opposite slope direction (Acclivity and Declivity) were observed on surface I for longitudinal and transverse orientation. The maximum slope observed was 1.74% (L4) on surface III in longitudinal orientation and a minimum of 0.06% (L3 and T2) on surface I.
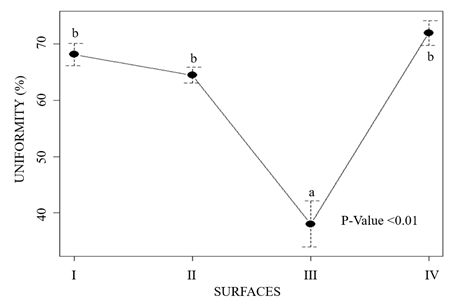
The comparative results between the uniformity measured by the UNF model between surfaces (Figure 3) identified a difference (P < 0.01) between surface III (UNF = 38.03%) and surfaces I (UNF = 68.14%), II (UNF = 64.51%), IV (UNF = 72.01%), which did not differ from each other. The averages differ from the final uniformity of each surface as they consider the total variation explained as repetition and are only used for comparison between surfaces.
DISCUSSION
The proposed model for measuring the uniformity of equestrian surfaces resulted in modeling the variation found, considering mathematical aspects to quantify the effects of each property on the mechanical behavior of the analyzed surfaces, based on significant comparisons, Hierarchical Cluster Grouping, Principal Component Analysis and corrective maintenance, as well as making it possible to compare surfaces (Figure 3). The methodology proposed in this study contributes to the development of technologies applied in equestrian sports, as the UNF model returns the percentage of mechanical uniformity of surfaces imposed on equine biomechanics, in addition to identify the effect of corrective maintenance. The differences between the uniformity measured by the K25 and Hierarchical Cluster methods are expected, due to the greater rigor in selecting groups by Euclidean distance (EVERITT et al., 2011; PETERSON et al., 2018). It is important to highlight that the UNF model considers the assumptions of greater uniformity limited by the coefficients and total variation explained by the main components (PC1 and PC2).

Comparison of uniformity (%) measured between the analyzed surfaces (I, II, III and IV). Different letters indicate significant difference (P < 0.01).
Principal component analysis demonstrated that there are known multifactorial relationships between moisture and grip on surface I (RATZLAFF et al., 1997; HOLT et al., 2014), however, no interaction was found between moisture and hardness as described by NORTHROP et al. (2016), this absence may be due to the constant climatic pattern of the experimental period, where all surfaces had similar moisture levels and were determined by the water retention capacity of the constituents (REICHARDT & TIMM, 2022; REICHERT et al., 2009), as no surface was irrigated or affected by rain prior to testing. The retention of distinct variables by principal component is a result of the complex and multifactorial interaction between mechanical properties, such that alterations in this pattern indicate the predominant property for explaining the variation (CHATEAU et al., 2009; HOBBS et al., 2014).
Depth can be indicated as the main responsible for the variation found on the surfaces, attributable to its high explanatory coefficients for the Main Components. This result fills an existing scientific gap on the interaction of depth with hardness, moisture and grip, categorizing the variation in the mechanical behavior of the studied surfaces (NORTHROP et al., 2016), which is confirmed by topographic altimetry (Table 6). The low levels of clay on the surfaces (Table 1) may also have influenced the changes, as the limited cohesion force between particles increases plasticity (WHEELER & ZAJACZKOWSKI, 2006; HOBBS et al., 2014), and may even cause direct interaction of the hoof with the base, generating high reactionary forces and vibration rates to the musculoskeletal system (SETTERBO et al., 2009).
The greatest uniformities occurred on surfaces I, II and IV in consequence of the low number of significant comparisons (P < 0.05) and the high percentage explained by the Main Components, as the UNF equation considers the effects of these factors for numerical modeling, as well as the corrective maintenance carried out, whose beneficial effects on animals are already known (PETERSON & MCILWRAITH, 2008). This approach makes it possible to quantify the real effect that can lead to changes in the hoof-surface interaction, as it is not possible to simply state that values of P < 0.05 imply a total absence of uniformity. Surface IV presents a peculiarity due to the absence of a built structural base (WHEELER & ZAJACZKOWSKI, 2006), and can be categorized as a “natural surface”, that is, the composition of the soil (Table 1) resulting from the climate, type of sedimentary rock, vegetation, relief and temporal space of the studied region (KALEV & TOOR, 2018). Moisture had the lowest uniformity (%), probably arising from the low topographic dip (0.07 to 0.30%) (Table 6).
The lowest uniformity was observed on surface III (Table 4 and Figure 3) with a result that could be associated with a lack of corrective maintenance and surface structural modifications (PETERSON & MCILWRAITH, 2008; ROHLF et al., 2023a). This surface presented longitudinal dip rates of 1.74% (Table 6), causing excessive movement of the surface layer due to the altimetric difference (SILVA et al., 2021), due to the impact of topography on the mechanical behavior of the surface (HERHOLZ et al., 2023; KOWALSKI et al., 2025). As the dip is close to the maximum limit of 2% (WHEELER & ZAJACZKOWSKI, 2006) and only one main component was retained, the total variation explained is low (44.26%), which influences the low uniformity of this surface.
Even though differences were observed between measurement areas during diving in longitudinal and transverse orientation on all surfaces (P < 0.05), these results are within the proposed values, however, diving less than 1% can impair the drainage capacity of the surface (WHEELER & ZAJACZKOWSKI, 2006). The photogrammetric aerial survey technique used in this study (BRUCH et al., 2019), which high precision and ease of use, however, it does not consider the depth of the surface in relation to the base, in this case, the depth can be subtracted from the surface by the altimetry of each collection point, enabling knowledge of the internal regions of the system and thus identifying the internal structure of the surface (KOWALSKI et al., 2025).
The comparison of uniformity among the tested surfaces in figure 3 proved effective for identifying and comparing the specific effect of maintenance on mechanical properties by using mathematical parameters to describe their dynamics, which is essential for replicating the methodology in different environments (HOBBS et al., 2014). These results can guide the intensification of corrective maintenance and indicate priority properties for attention at each location, although it is important to note that several maintenance related factors still require further scientific investigation.
Figure 2 illustrates, through contour maps, the unified mechanical spatial variation measured by the UNF model, using the median of the properties analyzed on each surface. It is important to emphasize that, for the generation of these maps, the weights of the variables derived from the coefficients of the principal components were not considered, because the UNF model provides a single, integrated response. Therefore, the visual representation may differ from a direct analysis of the results of the proposed model.
This result can be directly applied to surfaces used for Criollo breed horses and other breeds to ensure the uniformity imposed on these animals during high-intensity manoeuvres such as the esbarrada and volta sobre patas described by PIZZI et al. (2024), as well as various discipline-specific movements. The UNF model enables a proactive and evidence-based management approach by precisely identifying and quantifying the mechanical properties affecting surface uniformity, this allows for targeted corrective maintenance, such as adjusting depth or moisture, ultimately enhancing the safety and performance of all horses by ensuring a consistent and reliable surface across different equestrian activities.
The limitations of this study included the restricted number of mechanical properties analyzed and the reliance on specialized equipment and complex statistical methods, which may hinder the broad application of the developed model. To address these constraints, future research could apply the UNF model using data obtained from standardized devices such as the Clegg Hammer (CLEG, 1976), Orono Biomechanics Surface Tester (PETERSON et al., 2008), Glen Withy Torque Tester (LEWIS et al., 2016), Vienna Surface Tester (PEHAM & SCHRAMEL, 2017) and Linear Shear Testing Device (ROHLF et al., 2023b). Furthermore, incorporating additional mechanical properties into the equation and employing machine learning techniques could enhance the model’s accuracy and applicability.
CONCLUSION
The UNF model was able to determine and compare the uniformity of different equestrian surfaces considering aspects of mathematical modeling for its quantification, based on significant comparisons, Hierarchical Cluster Grouping and Principal Component Analysis.
ACKNOWLEDGMENTS
This study was financed in part by the Coordenação de Aperfeiçoamento de Pessoal de Nível Superior - Brasil (CAPES) - Finance Code 001.
REFERENCES
-
BLANCO, M. A. et al. An experimental comparison of simple measurements used for the characterization of sand equestrian surfaces. Animals, v.11, p.2896, 2021. Available from: <Available from: https://www.mdpi.com/2076-2615/11/10/2896 >. Accessed: Apr. 20, 2022. doi: 10.3390/ani11102896.
» https://doi.org/10.3390/ani11102896.» https://www.mdpi.com/2076-2615/11/10/2896 -
BOUYOUCOS, G. J. Hydrometer method improved for making particle size analysis of soils. Agronomy Journal, v.54, p.464-465, 1962. Available from: <Available from: https://acsess.onlinelibrary.wiley.com/doi/10.2134/agronj1962.00021962005400050028x >. Accessed: May, 19, 2023. doi: 10.2134/agronj1962.00021962005400050028x.
» https://doi.org/10.2134/agronj1962.00021962005400050028x.» https://acsess.onlinelibrary.wiley.com/doi/10.2134/agronj1962.00021962005400050028x -
BRUCH, A. F. et al. Evaluation of the accuracy of the mining volumes by means of conventional and photogrammetric surveys. Revista Brasileira de Geografia Física, v.12 n.01, 283-298, 2019. Available from: <Available from: https://periodicos.ufpe.br/revistas/index.php/rbgfe/article/view/237851/pdf >. Accessed: Apr. 15, 2023. doi: 10.26848/RBGF.V12.1.P283-298.
» https://doi.org/10.26848/RBGF.V12.1.P283-298.» https://periodicos.ufpe.br/revistas/index.php/rbgfe/article/view/237851/pdf -
CHATEAU, H. et al. Design and validation of a dynamometric horseshoe for the measurement of three-dimensional ground reaction force on a moving horse. Journal of Biomechanics, v.42, n.3, p.336-340, 2009. Available from: <Available from: https://www.sciencedirect.com/science/article/abs/pii/S0021929008005988 >. Accessed: Abr. 12, 2023. doi: 10.1016/j.jbiomech.2008.11.017.
» https://doi.org/10.1016/j.jbiomech.2008.11.017.» https://www.sciencedirect.com/science/article/abs/pii/S0021929008005988 -
CLEGG, B. An impact testing device for in situ base course evaluation. Australian Road Research Board, v.8, p.1-6, 1976. Available from: <Available from: https://www.issmge.org/uploads/publications/89/101/3ANZ_036.pdf >. Accessed: Apr. 02, 2023.
» https://www.issmge.org/uploads/publications/89/101/3ANZ_036.pdf -
DNER-PRO 003/94 - Coleta de amostras deformadas de solos. 1994. Available from: < Available from: https://www.gov.br/dnit/pt-br/assuntos/planejamento-e-pesquisa/ipr/coletaneadenormas/coletaneae-normas/procedimento-pro/dner-pro-003-94-1.pdf >. Accessed: Apr. 03, 2022.
» https://www.gov.br/dnit/pt-br/assuntos/planejamento-e-pesquisa/ipr/coletaneadenormas/coletaneae-normas/procedimento-pro/dner-pro-003-94-1.pdf -
EVERITT, B. S. et al. Wiley series in probability and statistics, p.71-110, 2011. Available from: <Available from: https://onlinelibrary.wiley.com/doi/book/10.1002/9780470977811 >. Accessed: Oct. 01, 2023. doi: 10.1002/9780470977811.
» https://doi.org/10.1002/9780470977811.» https://onlinelibrary.wiley.com/doi/book/10.1002/9780470977811 -
GOLDEN SOFTWARE, LLC. Surfer: contouring and 3D surface mapping. Version 10.2.601. Colorado, EUA: Golden Software, LLC, 2011. Available from: <Available from: https://www.goldensoftware.com/products/surfer/ >. Accessed: Nov. 29, 2025.
» https://www.goldensoftware.com/products/surfer/ -
GRAYDON, R. et al. The development of a standardized protocol for quantifying equestrian eventing cross-country ground. Biomechanics, v.3, p.343-361, 2023. Available from: <Available from: https://www.mdpi.com/2673-7078/3/3/29 >. Accessed: Apr. 06, 2022. doi: 10.3390/biomechanics3030029.
» https://doi.org/10.3390/biomechanics3030029.» https://www.mdpi.com/2673-7078/3/3/29 -
HERHOLZ, C. et al. Large temporal variations of functional properties of outdoor equestrian arena surfaces and a new concept of evaluating reactivity with light weight deflectometer settlement curves. Journal of Equine Veterinary Science, v.129, p.104909, 2023. Available from: <Available from: https://www.sciencedirect.com/science/article/pii/S0737080623007256?via%3Dihub >. Accessed: Jan. 05, 2024. doi: 10.1016/j.jevs.2023.104909.
» https://doi.org/10.1016/j.jevs.2023.104909.» https://www.sciencedirect.com/science/article/pii/S0737080623007256?via%3Dihub -
HERNLUND, E. et al. Comparing subjective and objective evaluation of show jumping competition and warm-up arena surfaces. The Veterinary Journal, v.227, p.49-57, 2017. Available from: <Available from: https://www.sciencedirect.com/science/article/pii/S1090023317301673 >. Accessed: Abr. 12, 2023. doi: 10.1016/j.tvjl.2017.09.001.
» https://doi.org/10.1016/j.tvjl.2017.09.001.» https://www.sciencedirect.com/science/article/pii/S1090023317301673 -
HOBBS, S. J. et al. Equine surfaces white paper. FEI Publication, 2014. Available from: <Available from: http://www.fei.org/fei/about-fei/publications/fei-books >. Accessed: Apr. 01, 2022.
» http://www.fei.org/fei/about-fei/publications/fei-books -
HOLT, D. et al. Use of surface testing devices to identify potential risk factors for synthetic equestrian surfaces. Procedia Engineering, v.72, p.949-954, 2014. Available from: <Available from: https://www.sciencedirect.com/science/article/pii/S1877705814006766 >. Accessed: Apr. 02, 2022. doi: 10.1016/j.proeng.2014.06.160.
» https://doi.org/10.1016/j.proeng.2014.06.160.» https://www.sciencedirect.com/science/article/pii/S1877705814006766 -
INMET. Instituto Nacional de Meteorologia. Painel de Dados: relative air humidity. 2023 Available from: <Available from: https://portal.inmet.gov.br/servicos/bdmep-dados-hist%C3%B3ricos >. Accessed: Feb. 28, 2023.
» https://portal.inmet.gov.br/servicos/bdmep-dados-hist%C3%B3ricos -
JAUD, M. et al. Assessing the accuracy of high resolution digital surface models computed by photoscan® and micmac® in sub-optimal survey conditions. Remote Sensing, v.8, n.6, p.118 2016. Available from: <Available from: https://www.mdpi.com/2072-4292/8/6/465 >. Accessed: Mar. 15, 2023. doi: 10.3390/rs8060465.
» https://doi.org/10.3390/rs8060465.» https://www.mdpi.com/2072-4292/8/6/465 -
KALEV, S. D.; TOOR, G. S. The composition of soils and sediments. Green Chemistry, p.339-357, 2018. Available from: <Available from: https://www.sciencedirect.com/science/article/abs/pii/B9780128092705000145 >. Accessed: Apr. 28, 2023. doi: 10.1016/b978-0-12-809270-5.00014-5.
» https://doi.org/10.1016/b978-0-12-809270-5.00014-5.» https://www.sciencedirect.com/science/article/abs/pii/B9780128092705000145 -
KOWALSKI, E. A. et al. Topographic modeling of equestrian surfaces: an innovative perspective with photogrammetric aerial survey. Revista Brasileira de Geografia Física, v.18, n.05, p.3738-3755, 2025. Available from: <Available from: https://periodicos.ufpe.br/revistas/index.php/rbgfe/issue/view/3773 >. Accessed: Jan. 09, 2025. doi: 10.26848/rbgf.v18.05.p3738-3755.
» https://doi.org/10.26848/rbgf.v18.05.p3738-3755.» https://periodicos.ufpe.br/revistas/index.php/rbgfe/issue/view/3773 -
LEWIS, K. et al. Comparison of equipment used to measure shear properties in equine arena surfaces. Biosystems Engineering, v.137, p.43-54, 2016. Available from: <Available from: https://www.sciencedirect.com/science/article/abs/pii/S153751101500121X >. Accessed: Mar. 15, 2023. doi: 10.1016/j.biosystemseng.2015.07.006.
» https://doi.org/10.1016/j.biosystemseng.2015.07.006.» https://www.sciencedirect.com/science/article/abs/pii/S153751101500121X -
MARTIN, R. B. The importance of mechanical loading in bone biology and medicine. Journal Musculoskelet Neuronal Interact, v.1, p.48-53, 2007. Available from: <Available from: https://pubmed.ncbi.nlm.nih.gov/17396005 >. Accessed: Mar. 19, 2023.
» https://pubmed.ncbi.nlm.nih.gov/17396005 -
NIGG, B. M.; YEADON, M. R. Biomechanical aspects of playing surfaces. Journal of Sports Sciences, v.5, p.117-45, 1987. Available from: <Available from: https://pubmed.ncbi.nlm.nih.gov/3326948/ >. Accessed: Mar. 05, 2022. doi: 10.1080/02640418708729771.
» https://doi.org/10.1080/02640418708729771.» https://pubmed.ncbi.nlm.nih.gov/3326948/ -
NORTHROP, A. J. et al. Operational temperatures of all-weather thoroughbred racetracks influence surface functional properties. Biosystems Engineering, v.193, p.37-45, 2020. Available from: <Available from: https://www.sciencedirect.com/science/article/abs/pii/S153751102030043X >. Accessed: Jul. 16, 2023. doi: 10.1016/j.biosystemseng.2020.02.003.
» https://doi.org/10.1016/j.biosystemseng.2020.02.003.» https://www.sciencedirect.com/science/article/abs/pii/S153751102030043X -
NORTHROP, A. J. et al. Spatial variation of the physical and biomechanical properties within an equestrian arena surface. Procedia Engineering, v.147, p.866-871, 2016. Available from: <Available from: https://www.sciencedirect.com/science/article/pii/S1877705816307354 >. Accessed: Jan. 01, 2022. doi: 10.1016/j.proeng.2016.06.288.
» https://doi.org/10.1016/j.proeng.2016.06.288.» https://www.sciencedirect.com/science/article/pii/S1877705816307354 -
ORLANDE, O. et al. Measuring hoof slip of the leading limb on jump landing over two different equine arena surfaces. Comparative Exercise Physiology, v.8, n.1, p.33-39, 2012. Available from: <Available from: https://brill.com/view/journals/cep/8/1/article-p33_33.xml >. Accessed: Feb. 24, 2022. doi: 10.3920/cep11011.
» https://doi.org/10.3920/cep11011.» https://brill.com/view/journals/cep/8/1/article-p33_33.xml -
PARKES, R. S. V.; WITTE, T. H. The foot-surface interaction and its impact on musculoskeletal adaptation and injury risk in the horse. Equine Veterinary Journal, v.47, n.5, p.519-525, 2015. Available from: Accessed: <Available from: Accessed: https://beva.onlinelibrary.wiley.com/doi/10.1111/evj.12420 >. Nov. 21, 2022. doi: 10.1111/evj.12420.
» https://doi.org/10.1111/evj.12420.» https://beva.onlinelibrary.wiley.com/doi/10.1111/evj.12420 -
PEHAM, C.; SCHRAMEL, J. P. Method and device for determining the coefficient of friction between the surface of a test object, in particular of a base and the surface of a test body. EP 3 141 886 A1, Mar. 2017. Available from: <Available from: https://worldwide.espacenet.com/patent/search/family/054150207/publication/EP3141886A1?q=15002632.6 >. Accessed: Mar. 15, 2022.
» https://worldwide.espacenet.com/patent/search/family/054150207/publication/EP3141886A1?q=15002632.6 -
PETERSON, A. D. et al. Merging K-means with hierarchical clustering for identifying general-shaped groups. Stat (Int Stat Inst), v.7, n.1, p.e172, 2018. Available from: <Available from: https://pubmed.ncbi.nlm.nih.gov/29736237/ >. Accessed: Nov. 05, 2022. doi: 10.1002/sta4.172.
» https://doi.org/10.1002/sta4.172.» https://pubmed.ncbi.nlm.nih.gov/29736237/ -
PETERSON, M. L.; MCILWRAITH, C. W. Effect of track maintenance on mechanical properties of a dirt racetrack: A preliminary study. Equine Veterinary Journal, v.40, p.602-605, 2008. Available from: <Available from: https://pubmed.ncbi.nlm.nih.gov/19031517/ >. Accessed: Out. 03, 2021. doi: 10.2746/042516408x330347.
» https://doi.org/10.2746/042516408x330347.» https://pubmed.ncbi.nlm.nih.gov/19031517/ -
PETERSON, M. L. et al. Development of a system for the in-situ characterisation of thoroughbred horse racing track surfaces. Biosysytems Engineering, v.101, p.260-269, 2008. Available from: <Available from: https://www.sciencedirect.com/science/article/abs/pii/S1537511008002298?via%3Dihub >. Accessed: Nov. 08, 2021. doi: 10.1016/j.biosystemseng.2008.07.007.
» https://doi.org/10.1016/j.biosystemseng.2008.07.007.» https://www.sciencedirect.com/science/article/abs/pii/S1537511008002298?via%3Dihub -
PIZZI, G. L. B. L. et al. 2D Kinematic analysis of the esbarrada and volta sobre patas manoeuvres of criollo breed horses competing in Freio de Ouro. Animals, v.14, p.2410, 2024. Available from: <Available from: https://www.mdpi.com/2076-2615/14/16/2410 >. Accessed: Dec. 24, 2024. doi: 10.3390/ani14162410.
» https://doi.org/10.3390/ani14162410.» https://www.mdpi.com/2076-2615/14/16/2410 -
RATZLAFF, M. H. et al. Interrelationships between moisture content of the track, dynamic properties of the track and the locomotor forces exerted by galloping horses. Journal of Equine Veterinary Science, v.17, p.35-42, 1997. Available from: <Available from: https://www.sciencedirect.com/science/article/abs/pii/S073708069780456X >. Accessed: Dec. 01, 2022. doi: 10.1016/S0737-0806(97)80456-X.
» https://doi.org/10.1016/S0737-0806(97)80456-X.» https://www.sciencedirect.com/science/article/abs/pii/S073708069780456X -
REICHARDT, K.; TIMM, L. C. Solo, planta e atmosfera: conceitos, processos e aplicações. Barueri: Manole, ISBN: 9786555764673, 2022. Available from: <Available from: https://repositorio.usp.br/item/003103881 >. Accessed: Sept. 09, 2023.
» https://repositorio.usp.br/item/003103881 -
REICHERT, J. M. et al. Estimation of water retention and availability in soils of Rio Grande do Sul. Revista Brasileira de Ciência do Solo, v.33, n.6, p.1547-1560, 2009. Available from: <Available from: https://www.scielo.br/j/rbcs/a/33pfsDfBNvcCnM4HLcnK5jk/abstract/?lang=en >. Accessed: Sept. 09, 2023. doi: 10.1590/s0100-06832009000600004.
» https://doi.org/10.1590/s0100-06832009000600004.» https://www.scielo.br/j/rbcs/a/33pfsDfBNvcCnM4HLcnK5jk/abstract/?lang=en -
ROHLF, C. M. et al. Arena surface vertical impact forces vary with surface compaction. The Veterinary Journal, v.293, p.105955, 2023a. Available from: <Available from: https://www.sciencedirect.com/science/article/pii/S1090023323000060 >. Accessed: Oct. 01, 2023. doi: 10.1016/j.tvjl.2023.105955.
» https://doi.org/10.1016/j.tvjl.2023.105955.» https://www.sciencedirect.com/science/article/pii/S1090023323000060 -
ROHLF, C. M. et al. Shear ground reaction force variation among equine arena surfaces, The Veterinary Journal, v.291, p.105930, 2023b. Available from: <Available from: https://pubmed.ncbi.nlm.nih.gov/36427603/ >. Accessed: Oct. 02, 2023. doi: 10.1016/j.tvjl.2022.105930.
» https://doi.org/10.1016/j.tvjl.2022.105930.» https://pubmed.ncbi.nlm.nih.gov/36427603/ -
SCHMITT, P. et al. Laser diffraction particle size distribution of north american turfgrass horse racing surfaces. American Society of Agricultural and Biological Engineers, v.66, p.735-746, 2023. Available from: <Available from: https://elibrary.asabe.org/abstract.asp?AID=54262&t=3&dabs=Y&redir=&redirType= >. Accessed: Feb. 18, 2024. doi: 10.13031/ja.15396.
» https://doi.org/10.13031/ja.15396.» https://elibrary.asabe.org/abstract.asp?AID=54262&t=3&dabs=Y&redir=&redirType= -
SETTERBO, J. J. et al. Hoof accelerations and ground reaction forces of Thoroughbred racehorses measured on dirt, synthetic, and turf track surfaces. American Journal of Veterinary Research, v.70, n.10, p.1220-1229, 2009. Available from: <Available from: https://pubmed.ncbi.nlm.nih.gov/19795936/ >. Accessed: Nov. 11, 2021. doi: 10.2460/ajvr.70.10.1220.
» https://doi.org/10.2460/ajvr.70.10.1220.» https://pubmed.ncbi.nlm.nih.gov/19795936/ -
SILVA, T. P. et al. Investigating spatial relationships of soil friability and driving factors through co-regionalization with state-space analysis in a subtropical watershed. Soil and Tillage Research, v.212, p.105028, 2021. Available from: <Available from: https://www.sciencedirect.com/science/article/abs/pii/S0167198721000982 >. Accessed: Sept. 10, 2023. doi: 10.1016/j.still.2021.105028.
» https://doi.org/10.1016/j.still.2021.105028.» https://www.sciencedirect.com/science/article/abs/pii/S0167198721000982 -
SOUZA, B. M. M. et al. Strength and deformation behavior of equestrian riding surfaces improved with recycled geosynthetics. ASTM International. Geotechnical Testing Journal, v.47, p.GTJ20220245, 2024. Available from: <Available from: https://asmedigitalcollection.asme.org/geotechnicaltesting/article-abstract/47/1/GTJ20220245/1177540/Strength-and-Deformation-Behavior-of-Equestrian?redirectedFrom=fulltext >. Accessed: Jul. 15, 2024. doi: 10.1520/GTJ20220245.
» https://doi.org/10.1520/GTJ20220245.» https://asmedigitalcollection.asme.org/geotechnicaltesting/article-abstract/47/1/GTJ20220245/1177540/Strength-and-Deformation-Behavior-of-Equestrian?redirectedFrom=fulltext -
SYMONS, J. E. et al. Modeling equine race surface vertical mechanical behaviors in a musculoskeletal modeling environment. Journal of Biomechanics, v.48, n.4, p.566-572, 2015. Available from: <Available from: https://pubmed.ncbi.nlm.nih.gov/25634662/ >. Accessed: Jan. 02, 2022. doi: 10.1016/j.jbiomech.2015.01.006.
» https://doi.org/10.1016/j.jbiomech.2015.01.006.» https://pubmed.ncbi.nlm.nih.gov/25634662/ -
SYMONS, J. E. et al. Distal hindlimb kinematics of galloping Thoroughbred racehorses on dirt and synthetic racetrack surfaces. Equine Veterinary Journal, v.46, n.2, p.227-232, 2013. Available from: <Available from: https://beva.onlinelibrary.wiley.com/doi/abs/10.1111/evj.12113 >. Feb. 02, 2022. doi: 10.1111/evj.12113.
» https://doi.org/10.1111/evj.12113.» https://beva.onlinelibrary.wiley.com/doi/abs/10.1111/evj.12113 -
TEIXEIRA, P. C. et al. Manual de métodos de análise de solo 3. Edição - Brasília, DF: Embrapa. ISBN 978-85-7035-771-7, 2017. Available from: <Available from: https://www.embrapa.br/busca-de-publicacoes/-/publicacao/1085209/manual-de-metodos-de-analise-de-solo >. Accessed: Feb. 08, 2022.
» https://www.embrapa.br/busca-de-publicacoes/-/publicacao/1085209/manual-de-metodos-de-analise-de-solo -
VALERIANO, M. M.; ROSSETTI, D. F. Topodata: Brazilian full coverage refinement of SRTM data. Applied Geography (Sevenoaks), v.32, p.300-309, 2011. Available from: <Available from: https://www.sciencedirect.com/science/article/abs/pii/S0143622811000786?via%3Dihub >. Accessed: Jun. 10, 2023. doi: 10.1016/j.apgeog.2011.05.004.
» https://doi.org/10.1016/j.apgeog.2011.05.004.» https://www.sciencedirect.com/science/article/abs/pii/S0143622811000786?via%3Dihub -
WHEELER, E.; ZAJACZKOWSKI, S. Riding arena footing materials. In: WHEELER, E. (ed.) Horse stable and riding arena design. 1st ed. Blackwell Publishing, Malden, UK, p.267-278, 2006. Available from: <Available from: https://extension.psu.edu/riding-arena-footing-material-selection-and-management >. Accessed: Oct. 10, 2021.
» https://extension.psu.edu/riding-arena-footing-material-selection-and-management
-
CR-2025-0181.R1
-
DATA AVAILABILITY STATEMENT
Not applicable.
-
DECLARATION OF USE OF ARTIFICIAL INTELLIGENCE
During the writing of this article, the authors used ChatGPT and DeepSeek to check grammar. After using this tool, the authors reviewed and edited the content as needed and took full responsibility for the content of the publication.
Edited by
-
ASSOCIATE EDITOR:
Rudi Weiblen (0000-0002-1737-9817)
-
SCIENTIFIC EDITOR:
Gustavo Miranda Zanotto (0000-0001-8498-5246)
Not applicable.