 How to realize the value-added of rural homestead? evidence from China
ABSTRACT:
Assessing incremental land value is a key issue in rural land system reform. This study clarifies the formation mechanism of incremental income of idle homestead (IIIH), analyzes its spatial distribution characteristics using exploratory spatial data analysis methods, and identifies the spatial heterogeneity of its influencing factors using a geographically weighted regression model. The results showed that: (1) The idle homesteads have higher increment income. The Cities with high IIIH are concentrated in the Yangtze River Delta (YRD), Pearl River Delta (PRD), Chengdu-Chongqing and Bohai Rim urban agglomerations. Provincial capitals and cities specifically designated in the state plan exhibit higher IIIH than ordinary prefecture-level cities; (2) The IIIH involves two stages, “implicit” and “explicit”, and follows two distinct paths characterized by “high development capacity” and “low development capacity”; (3) Spatial heterogeneity exists in the effects of the factors influencing IIIH. The regression coefficients for urban grade, output value of the tertiary industry, health care resources and education funding input show increasing trends from north to south, west to east, south to north and northwest to southeast respectively. Based on the conclusions, this article proposes that: first, cross-province and cross-city trading mechanisms for surplus construction land quotas should be promoted according to local conditions. Second, farmers’ contributions during the “implicit” increment stage should be recognized in the distribution of incremental income. Third, a differentiated distribution pattern for increment income should be established based on the primary drivers of IIIH for different types of idle homesteads.
Key words:
homestead; incremental income; spatial differentiation; driving mechanism; geographically weighted regression
RESUMO:
A avaliação do incremento do valor da terra é uma questão fundamental na reforma do sistema fundiário rural. Este estudo procura esclarecer o mecanismo de formação do incremento de renda de propriedades rurais ociosas (IIIH) utilizando métodos exploratórios de análise de dados espaciais e modelos de regressão geogeo-ponderados para analisa suas características de distribuição espacial e identifica a heterogeneidade espacial de seus fatores de influência. Para isso, Os resultados mostram que (1) As propriedades rurais ociosas apresentam maior incremento de renda. As cidades com alto IIIH concentram-se no Delta do Rio Yangtzé (YRD), no Delta do Rio das Pérolas (PRD), em Chengdu-Chongqing e nas aglomerações urbanas da Orla do Mar de Bohai. Capitais provinciais e cidades especificamente designadas no plano estatal apresentam maior IIIH do que cidades comuns de nível de prefeitura; (2) O IIIH envolve dois estágios, “implícito” e “explícito”, e segue dois caminhos distintos caracterizados por “alta capacidade de desenvolvimento” e “baixa capacidade de desenvolvimento”; (3) Existe heterogeneidade espacial nos efeitos dos fatores que influenciam o IIIH. Os coeficientes de regressão para o grau de urbanização, o valor da produção do setor terciário, os recursos de saúde e o investimento em financiamento da educação mostram tendências crescentes de norte a sul, de oeste a leste, de sul a norte e de noroeste a sudeste, respectivamente. Com base nesses resultados, sugerimos que, o mecanismos de negociação interprovincial e intermunicipal para cotas excedentes de terrenos para construção devem ser promovidos de acordo com as condições locais; que as contribuições dos agricultores durante o estágio de incremento “implícito” devem ser reconhecidas na distribuição da renda incremental e por último que um padrão de distribuição diferenciado para a renda incremental deve ser estabelecido com base nos principais fatores determinantes da Renda Incremental de Propriedade Rural (RIPR) para diferentes tipos de propriedades rurais ociosas.
Palavras-chave:
propriedade rural; renda incremental; diferenciação espacial; mecanismo determinante; regressão geograficamente ponderada
INTRODUCTION
In the process of rapid urbanization and industrialization, many young and middle-aged rural laborers have migrated to the cities, and making the phenomenon of idle rural houses increasingly prominent. Estimates based on typical village survey data indicated that the average idle rate of rural homestead exceeds 10% (KONG et al., 2018; XIE et al., 2023). While rural land resources are idle, urban land resources are in short supply (YUAN et al., 2022). This has become a serious problem in both urban and rural land use efficiency. To alleviate the contradiction between urban and rural construction land supply and improve the efficiency of land resources utilization, the General Office of the CPC Central Committee (GOCCCPC) and the General Office of the State Council (GOSC) jointly issued the Opinions on the Pilot Work of Rural Land Acquisition, Market Entry of Collective Management Construction Land and the Reform of Homestead System in 2014. This document proposed exploring “voluntary and compensated withdrawal or transfer of homestead within the collective economic organization of the village by farmers who have settled in the city” (GOCCCPC & GOSC, 2014), which marked that the homestead system reform has officially entered the pilot stage. The Opinions on the Construction of a More Perfect System and Mechanism for the Market-based Allocation of Elements proposed to “deepen the pilot work of rural homestead system reform, further promote the consolidation of construction land, improve the policy of linking the increase and decrease of urban and rural construction land, and provide land elements for rural revitalization and the integrated development of urban and rural areas” (CPC & SC, 2020). The homestead system reform pilot combined with the policy of linking the increase and decrease of urban and rural construction land has explored various models for reclaiming and revitalizing idle homesteads, such as the “Land Coupons” and “Land Replacement” models (TIAN et al., 2024). While the models have achieved remarkable results, they have also exposed the problem of unequal distribution of IIIH, intensifying social conflicts.
Addressing the distribution problem of IIIH requires first clarifying its formation mechanism and spatial distribution characteristics. A review of existing literature reveals that scholars have not yet systematically and specifically analyzed the formation mechanism and spatial distribution of IIIH (WANG et al., 2024; GUO et al., 2023; ESHETU et al., 2018). Although, some studies touch upon the formation mechanism of IIIH when examining distribution of IIIH (HU, 2023; YANG et al., 2018; GAO et al., 2020), they primarily focused on analyzing the contribution of different actors, the risks they bear, and the form of value, often neglecting critical argumentation of the underlying driving (ZOU, 2021). At the same time, existing studies measuring IIIH are typically limited to a specific city, failing to capture the spatial differentiation at the national level, which leads to an overly homogeneous understanding of the IIIH distribution. What is the actual amount of IIIH? What factors lead to differences in IIIH? The issue has not been studied. Therefore, research on the actual magnitude of IIIH and the factors contributing to its heterogeneity of IIIH is urgently needed.
Based on clarifying the formation mechanism of IIIH, this study constructs a measurement method for IIIH, empirically calculates its value, explores the spatial distribution characteristics, and empirically analyzes the spatial heterogeneity of its driving mechanism using a geographically weighted regression model (GWR). This study provided references for developing distribution theory and the formulating distribution policies for IIIH.
Theoretical analysis
Under the model of linking the increase and decrease of urban and rural construction land, the formation of IIIH is in line with the general rule of land increment income formation and possesses the attributes of land rent. Marxist rent theory posits that: first, land rent arises from the separation of ultimate land ownership from the rights of land occupation and use. Second, land rent constitutes a significant form through which land ownership realizes its value increment. Third, land rent can be categorized into absolute rent and differential rent. Marxist rent theory is applicable to analyzing land value increment in developing countries (DEBARSHI, 2023). ECONOMAKIS (2003) contends that Marx’s concept of differential rent should also encompass “political rent”. TAKENAGA (2018) argues that investment flows also exert a significant influence on land rents. The formation of IIIH is precisely the product of land rights monopoly and the separation of land rights. The amount of IIIH is directly related to the income derived from absolute rent and differential rent. Conversely, the farmer’s monopoly on homestead use right provides the conditions for the land rents formation. Conversely, the introduction of the policy separating the “three rights” of homesteads (ownership, qualification, and use rights) has created a pathway for the realizing land rent (WANG & LI, 2024). Under the model of linking the increase and decrease of urban and rural construction land, IIIH is generated through land use change. Idle homesteads withdrawn by farmers are reclaimed as arable land, farmers give up their right to develop the homestead as collective construction land and transfer the formed construction land quotas to urban areas, achieving a cross-spatial transfer of development rights and interests from idle homesteads (ZHAO et al., 2024). The form of land rent for idle homestead also has different connotations in areas where homesteads are demolished and in areas where construction land indicators are used. In terms of the land rent in demolition areas: differential rent I can be understood as rent formed by the differences in homestead location conditions; differential rent II can be understood as rent formed firm material and emotional capital investment made by farmers using the homestead for housing or productive activities; Absolute rent can be understood as rent due to restriction on homestead eligibility; Monopoly rent can be understood as rent formed by controlling the total homestead supply. Regarding land rent in areas using construction land quotas: Differential rent I can be understood as the rent formed by differences in the economic and natural environment of the construction land; Differential rent II can be understood as the rent formed by capital investments of the construction land user for different purposes; Absolute land rent can be understood as the rent formed by the state’s monopoly on construction land ownership; Monopoly rent can be understood as rent formed due to the contradiction between the supply and demand of construction land. The higher the transfer price of construction land indicators, the greater the IIIH.
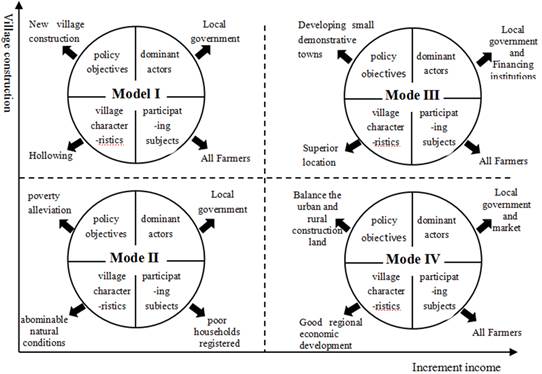
Under the model of linking the increase and decrease of urban and rural construction land, IIIH formation exhibits both the general regularity of land incremental income formation and its own specific characteristics. This study compares four typical models for revitalizing idle homesteads under this policy of linking the increase and decrease of urban and rural construction land, including “merging villages” (Model I), “relocation of poverty alleviation” (Model II), “exchanging rural homestead with well-planned urban house”(Model III) and “land Coupons” (Model IV), analyzing their similarities and differences in terms of policy objectives, dominant actors, participating subjects and village characteristics, as shown in figure 1. Figure 1 indicates that: from the perspective of policy objectives, Models I and II aim to improve farmers’ living conditions and enhance rural land use efficiency, while Models III and IV aim to integrate urban and rural development and address urban and land use issues. Regarding dominant actors, IIIH formation in Mode I and Mode II is primarily policy-driven by local governments, whereas in Models III and IV, it is driven by both local government policies and market forces. Concerning participating subjects, except for Mode II, which specifies registered poor households as participants, the other three model involve farmers who voluntarily withdraw from their idle homesteads. Pertaining to village characteristics, Model I and Model II are mainly applicable to regions with poor basic conditions and relatively low economic development levels, while Mode III and Mode IV are primarily in regions with superior economic conditions and obvious locational advantages.
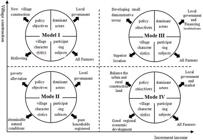
Comparison of typical models of idle homestead revitalization under the policy of linking the increase and decrease of urban and rural construction land.
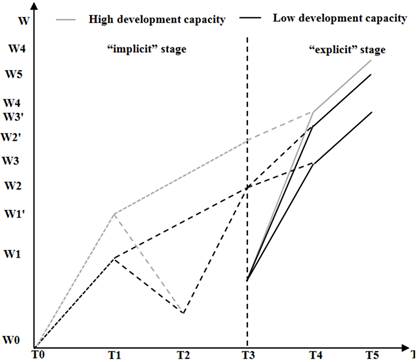
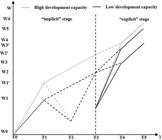
Based on the spatial transfer characteristics of development rights for idle homesteads and the unique nature of their value increment formation, this study elaborates on the pathways for generating IIIH, as illustrated in figure 2. Considering the spatial transfer characteristics of development rights for idle homesteads, the process of value increment formation can be divided into two stages: “implicit” value increment and “explicit” value increment. Considering the unique nature of value appreciation gains from idle homesteads, the formation pathway can be categorized into two distinct paths: “low development capacity” and “high development capacity”. During the initial “implicit” value-added phase (T0-T3), farmers acquire homesteads without compensation. They utilize these land plots for housing construction and production activities, investing in the initial material capital and emotional capital of the homestead. Among these, regions with “high development capacity” possess better locational advantages compared to those with “low development capacity”. During the initial “implicit” appreciation of idle homesteads, they gain additional locational increment, with the increased incremental income being W1’-W1. After farmers withdraw from idle homesteads, to facilitate the cross-regional transfer of rights for changing homestead utilization methods, the land is reclaimed as farmland, generating construction land quotas and enabling a secondary “implicit” appreciation of idle homesteads. Compared to regions with “low development capacity”, areas with “high development capacity” exhibit robust economic demand for construction land. Given the inelastic natural supply of construction land, the supply-demand imbalance becomes pronounced. This creates an additional supply-demand-driven increment in value during the secondary “implicit” appreciation of idle homesteads, which increases the value added by W2’-W2. The “explicit” increment stage of idle homesteads (T3-T5), to secure construction land quotas, farmland in the new development zone is expropriated and developed, generating the initial “explicit” increment of idle homesteads (W3-W2 and W3’-W2’). When the construction land transitions from raw land to developed land, the government conducts “tender-bid-auction” transfers, generating the second wave of explicit appreciation for idle homesteads (W4-W3 and W4’-W3’). Throughout this process, the factors influencing the appreciation income of idle homesteads follow consistent patterns across both the “high development capacity” and “low development capacity” pathways. These factors include functional value-added, locational value-added, investment value-added, policy-driven value-added, and supply-demand value-added. However, the magnitude of value-added across these factors differs between the two pathways. Additionally, during the initial “explicit” value-added phase of idle homesteads, certain “low development capacity” regions - such as the deeply impoverished counties - achieved higher value-added gains due to national policies permitting cross-provincial allocation of surplus indicators from “increase-decrease linkage” projects. The excess value-added gain in these areas is denoted as W5−W3. Overall, the “implicit” value-added phase of idle homestead land serves as the foundation for the “explicit” phase, while the latter drives the emergence of the former. Together, these two phases constitute the process of generating value-added gains from the conversion of idle homesteads.
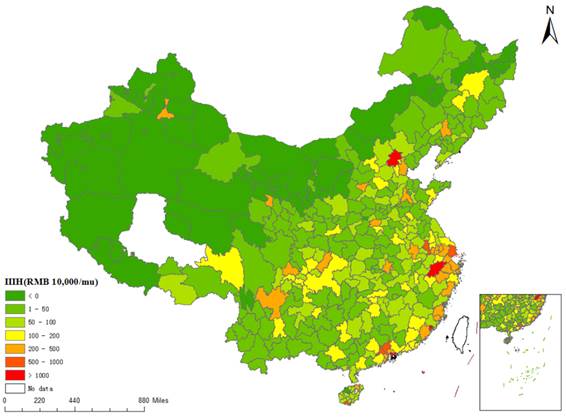
The spatial distribution of incremental income of idle homestead at the municipal level in China.
MATERIALS AND METHODS
Data
Data on the measuring IIIH
This study measures the IIIH by city and analyses the spatial distribution pattern of the IIIH based on the constructed method. Data required for calculating IIIH includes the transfer price of construction land use right, rural housing demolition costs, land reclamation costs, land acquisition costs, and the costs of “five available and one leveling” (ensuring water, electricity, roads, gas, telecommunications connections, and site leveling before project commencement). Data on construction land use right transfer price come from the China Land and Resources Statistical Yearbook. This study used the price from “bid invitation, auction, and listing” transfers as the transfer price, as this method better reflects the market price of land. Therefore, the IIIH measured in this study is relatively high. Data on rural housing demolition, land reclamation, and “five available and one leveling” costs are estimated based on research team data, literature and project data from official websites. Land acquisition costs comprise the sum of land compensation and resettlement subsidies (the integrated land section price). Data on the average integrated land section price for each city is taken from provincial documents. Data on social security fees and seedling compensation fees are estimated based on officially published data. Due to data unavailability, Taiwan Province, Hong Kong Special Administrative Region and Macau Special Administrative Region are excluded. Based on available data, costs for IIIH are classified the into four tiers according to China’s city hierarchy. Estimated data are shown in table 1.
Data for analyzing factors influencing IIIH
This study is based on the county-level cities in China. It empirically analyzed the impact of factors such as city hierarchy, tertiary industry output (per capita), health care resources (per thousand people), and education funding investment (per capita) on IIIH. All variable data were standardized. Data from 19.07% of county-level cities were missing and thus excluded, resulting in 297 county-level cities as the final research subjects. City hierarchy references relevant national regulations. Data on tertiary industry output comes from the provincial Statistical Yearbooks. Health care resources are determined by two indicators: the number of beds in health care institutions and health care funding input. Each weighed 50%. Data on the number of beds come from the China Urban Statistical Yearbook, and data on health care funding input come from provincial Statistical Yearbooks, Financial Statistical Yearbooks, Statistical Bulletin on National Economic and Social Development, and financial reports of selected cities. Data on investment in education come from the China Urban Statistical Yearbook and do not distinguish between basic and higher education. As this study focused on the regional-level operations, the total expenditure variable can directly measure macro-policy implementation.
Methods
Calculation method of IIIH
The surplus value method is an important approach to assessing land’s potential value. Its basic premise defines land value as the price after development and use minus associated costs (PAT et al., 2018). This method is suitable for valuing general, marketable construction land and is characterized by clear logic and high accuracy. Since the revitalization model in this study specifically aims to generate construction land with relatively high liquidity, the surplus value method is most appropriate. According to the IIIH formation path, IIIH is the difference between the construction land use right transfer price and the homestead value in demolition areas, minus the cost of rural housing demolition, land reclamation, land acquisition, and “five available and one leveling”. The homestead value can be regarded as zero based on theory and practical circumstances for three reasons: First, homestead use rights have “security” characteristics, transfer rights are “restricted”, and income rights are “adsorptive”, rendering homesteads non-marketable and devoid of market value. Second, in practice, homestead value is often ignored during withdrawal, and farmers receive no compensation for it (QI et al., 2022). Third, farmers initially acquired homestead at no cost. Therefore, treating homestead value as zero in calculations is theoretically and practically justified. Additionally, local governments often promote the model of linking the increase and decrease of urban and rural construction land to alleviate the pressure from shortages of local urban construction land (LIU et al., 2015). Hence, this study assumes construction land indicators trading occurs within the same province. The formula for measuring the IIIH can be expressed as:
W = P - C (1)
C = C1 + C2 + C3 + C4 (2)
In equation 1, W represents IIIH, P represents the transfer price of construction land use right, and C represents the total cost of forming IIIH. In equation 2, C1 represents rural housing demolition cost, C2 represents land reclamation cost, C3 represents land acquisition cost (including land compensation fees, resettlement subsidies, social security fees, and seedling compensation fees), and C4 represents the cost of “five availables and one leveling”.
Exploratory spatial data analysis (ESDA) method
ESDA is a method that objectively reveals spatial correlation dynamics among geographical objects through global and local spatial autocorrelation analysis (DOU et al., 2016). It is key in research that involves geographic data (PERCIVAL et al., 2022). This method clearly examined the spatial correlation characteristics of municipal-level IIIH. Global spatial autocorrelation is analyzed using the Global Moran’s I index, which is calculated as:
(3)
In equation 3, n is the number of study areas, X̄ is the sample mean, S2 is the sample variance, Xi and Xj represents the value of the IIIH in areas i and j, Wij is the spatial weight matrix. This study adopts a contiguity spatial weight matrix. The value range of Moran’ I is between -1 and 1. The closer Moran’ I is to 1, the stronger the positive spatial correlation; The closer Moran’ I is to -1, the stronger the spatial negative correlation.
Ordinary least squares (OLS) regression model
The OLS model explains the multivariate linear relationship between the dependent and independent variables. This study uses OLS to analyzes the linear relationship between IIIH and its influencing factors, which is modeled as:
(4)
In equation 4, yi is the dependent variable, βo is the constant term, βi are the regression coefficients, i is the random error term.
Geographically weighted regression (GWR) model
The GWR model extends traditional regression model by incorporating spatial location information, enabling local parameters estimation and effectively addressing spatial non-stationarity, thereby revealing the spatial regularity of variable relationships. GWR model offers a compelling explanation for the spatial differentiation of driving factors, making it suitable for analyzing the spatial differentiation of the IIIH. Which is modeled as:
(5)
In equation 5, Y i is n×1dimension dependent variable, representing the IIIH. Xik is n × k dimension independent variable matrix, representing the urban grade, output value of the tertiary industry, health care resources and education funding input. βk(ui,vi)k = 1,2,3… is the regression coefficient of the factor k at the regression point i, 𝜀i is an independent and identically distributed random error term.
The GWR model uses Weighted Least Squares (WLS) for parameter estimation at each observation point. The weighting is generally done using a Gaussian function, with bandwidth selection via the Akaike Information Criterion (AIC) method and kernel density estimation, followed by GWR calculation. The weight function determined by the Gaussian function as:
(6)
In equation 6, b is the broadband, and dij is the distance between the sample points i and j. If the data of i is observed, the weight of the other points decreases according to the Gaussian curve as the distance dij increases. When given broadband b, the greater the distance dij, the smaller the weight assigned to position j, which will tend to zero for points far enough away from i.
RESULTS
Spatial distribution characteristics of IIIH
According to the calculation method of IIIH, this study calculates IIIH at the municipal level in China. IIIH values were divided into seven degrees, and ArcGIS software was used to map the spatial pattern (Figure 3). Figure 3 shows that the spatial distribution of IIIH exhibits significant regional spatial agglomeration differences and administrative hierarchy differences at the municipal level in China. High-IIIH cities cluster in the Yangtze River Delta (YRD), Pearl River Delta (PRD), Chengdu-Chongqing and Bohai Rim urban agglomeration. Particularly, in the YRD, high-IIIH cities are widely distributed. Low-IIIH cities are mainly clustered in inland areas. Some provinces, like Heilongjiang, Qinghai, Inner Mongolia and Xinjiang, exhibit negative IIIH. Cities with higher administrative levels generally have greater IIIH. Provincial capitals and cities specifically designated in the state plan show higher IIIH than ordinary prefecture-level cities. Specifically, among the top 50 cities by IIIH, 22 are provincial capitals and 3 are specially designated cities.
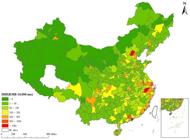
The spatial distribution of incremental income of idle homestead at the municipal level in China. Note: All maps in this study were produced in accordance with the standards specified in the Ministry of Natural Resources’ approved map number GS (2019)1815, with no modifications made to the base map.
Spatial correlation characteristics of IIIH
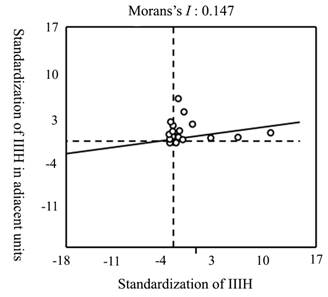
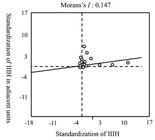
Based on the spatial distribution analysis, ESDA is used to further explore spatial correlation characteristics of municipal-level IIIH in China. I GeoDa software calculates the global Moran’s I index for IIIH. Figure 4 shows a global Moran’s I of 0.147, with a Z-value of 5.979, significant at the 1% level. This indicated significant spatial clustering and positive spatial correlation in municipal-level IIIH distribution in China. Regions with high or low IIIH tend to cluster, and IIIH exhibits spillover effects between adjacent cities.
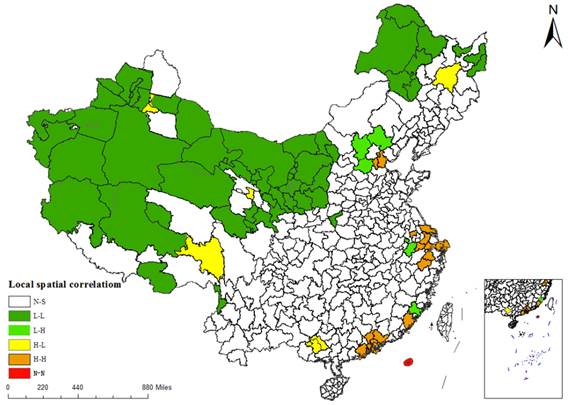
Local spatial autocorrelation is analyzed using LISA spatial clustering maps, as shown in figure 5. Figure 5 shows that: (1) “High - High” regions are mainly in the eastern coastal area, including Beijing-Tianjin, Yangtze River Delta, West Coast of the Taiwan Strait, and Pearl River Delta. These are leading economic development areas with strong land demand, coupled with relatively limited land area, this leads to land oversupply pressure and increased land transfer price. (2) “High-Low” regions are mainly inland provincial capitals like Harbin, Urumqi, Xining and Nanning. These cities have comparative advantages in political, economic, and cultural development, resulting in higher IIIH than their neighbors. (3) “Low-High” IIIH regions are relatively few, mainly including Baoding, Zhangjiakou and Chengde around Beijing-Tianjin; Yicheng and Maanshan around the YRD; and Quanzhou on the west coast of the Taiwan Strait. (4) “Low-Low” IIIH regions have the widest distribution, mainly in western Inner Mongolia, Xinjiang Uygur, Tibet, Gansu, Shaanxi, Qinghai, and northeastern Heilongjiang. Economic development in these provinces is relatively lagging, land supply-demand contradiction is less prominent, and there is less room for land appreciation.
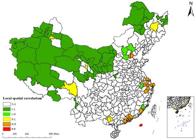
The spatial correlation patterns of incremental income of idle homestead at the municipal level in China.
Driving factors of IIIH formation
Based on the formation mechanism analysis, factors affecting IIIH mainly include location conditions, capital investment, land use, supply and demand, and policy intervention, with heterogeneity in their effects across regions. This study empirically analyzes the spatial heterogeneity of the effects of these factors on IIIH. Since the final IIIH based on the “bid invitation, auction and listing” price of construction land indicators, the impact of land use is not empirically analyzed further. The focus is on exploring the spatial heterogeneity of location conditions (represented by public service levels like healthcare and education), supply and demand (represented by industrial development level), and policy interventions (represented by urban grade). Better health care and education resources enhance land location competitiveness and value (WANG & BADDELEY, 2016; HAN et al., 2020). City industrial development increases demand for industrial, residential, and recreational land, driving land value growth (FANG et al., 2021). Higher urban grade implies greater local government “negotiating” power, more investment in policy incentives and infrastructure, and greater potential for land value increase.
Results and analysis of OLS model regression
To identify the global (average) impact of key influencing factors and exclude variables with Variance Inflation Factor (VIF) values greater than 10, an OLS regression is first performed. The OLS model regression results are shown in table 2. Table 2 shows that all four variables, namely, urban grade, output value of tertiary industry, health care resources and education funding input, have a significant effect on IIIH. Among them, the output value of the tertiary industry has the strongest positive influence, indicating it is the main driver of IIIH increase. Education funding input has the second strongest positive impact, suggesting education resources are a distinct advantageous locational condition increasing urban land value. Urban grade has a significant positive effect, indicating higher-grade cities have stronger government capacity to promote development, greater land demand, and more IIIH space. Health care resources have a significant negative effect, indicating they are less attractive for land investment in this context.
Results and analysis of GWR model regression
Given by IIIH’s significant spatial correlation and heterogeneity, a GWR model is used to analyze the spatial heterogeneity of influencing factors. The coefficient’s sign indicates the direction of influence, and its value indicates the strength. In this study, ArcGIS 10.2 software was used for GWR model construction, selecting Adaptive Gaussian kernel type and AIC bandwidth selection method. The regression results of the GWR model are shown in table 3 and table 4. Table 3 shows the GWR model’s R2 is 0.875, which is 0.322 higher than the R2 of the OLS model, indicating that the GWR model has a better goodness of fit. In addition, The AICc value for GWR model is -1246.801, differing by more than 3 from the AICc value of the OLS model, which further confirming the better fit of GWR model. Table 4 shows the order of influencing factor regression coefficients in GWR model is consistent with OLS model. Meanwhile, their mean values are similar. Based on the average regression coefficients of various factors in the GWR model, the urban grade and health care resources exert a significant negative impact, with average coefficients of -0.001 and -0.380, respectively. Meanwhile, the output value of the tertiary industry and education funding input demonstrate a significant positive influence, with average coefficients of 0.404 and 0.393, respectively. The standard errors of all regression coefficients are extremely small, and all significance levels are below 0.01. The OLS model can reflect the average level of the impact of each influencing factor on the IIIH. However, in terms of the minimum, lower quartile, median, upper quartile and maximum values of the regression coefficients of the influencing factors of the GWR model, the regression coefficients of the influencing factors of the GWR model are both positive and negative, and the magnitude of the changes is relatively large. It indicates that the IIIH and their influencing factors are not in a stable coefficient relationship, and the OLS model ignores the spatial differences in the regression coefficients of the influencing factors.
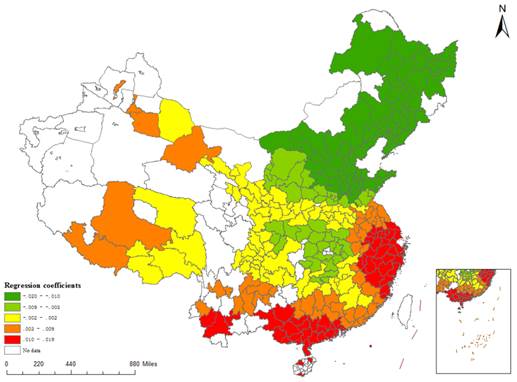
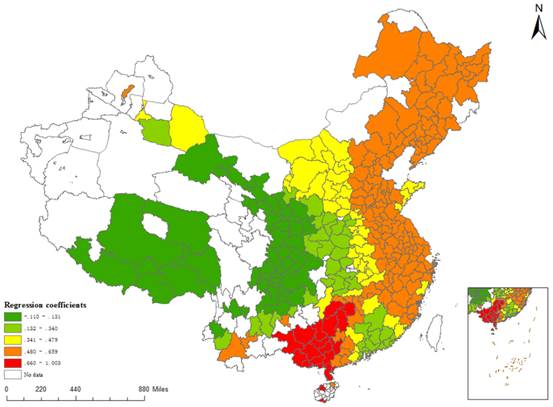
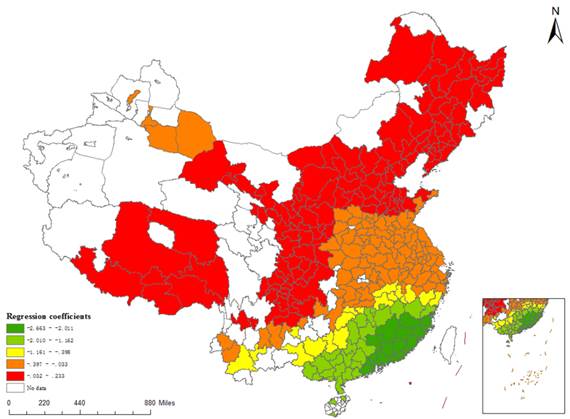
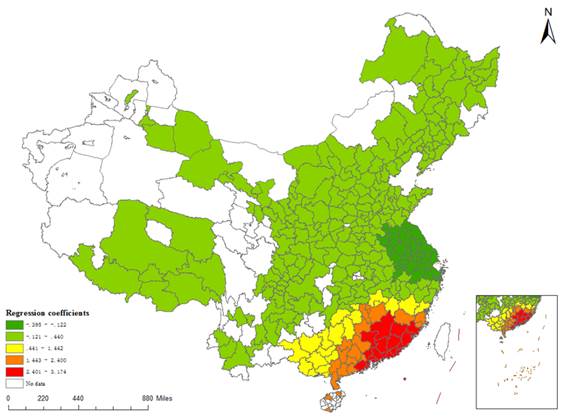
The regression coefficients from the GWR model for each city are visualized using ArcGIS 10.2, intuitively reflecting the spatial variation in the impacts of urban grade, tertiary industry output value, healthcare resources, and education funding input on IIIH. The results are shown in figure 6, figure 7, figure 8 and figure 9.
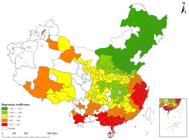
Spatial distribution of regression coefficients for the impact of urban grade on incremental income of idle homestead in China.
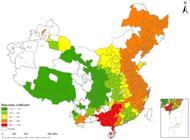
Spatial distribution of regression coefficients for the impact of output value of the tertiary industry on incremental income of idle homestead in China.
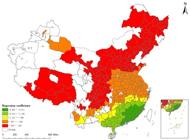
Spatial distribution of regression coefficients for the impact of health care resources on incremental income of idle homestead in China.
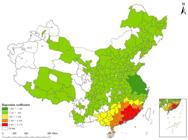
Spatial distribution of regression coefficients for the impact of education funding input on incremental income of idle homestead in China.
(1) The characteristics of spatial variation in the effect of urban grade on IIIH. The spatial distribution of the regression coefficients in figure 6 shows that the urban grade regression coefficients generally show a sequential increase from north to south. Positive coefficients are mainly concentrated in the YRD, West Coast (WC), PRD, Beibu Gulf (BG), and Central Yunnan (CY) urban agglomerations. For each unit increase in urban grade, IIIH increases by 0.003% to 0.019%. This is mainly because higher urban grade undertakes more political and economic functions, receive stronger policy advantages, have higher development capacity, greater land resources demand, and thus more land appreciation potential. Negative coefficients cluster in northeast, north and northwest China. Some cities in these regions, such as Benxi, Fuxin and Tonghua in Northeast, Zhangjiakou, Datong, Jinzhong and Wuhai in North, and Yulin, Tianshui and Shizuishan in Northwest, despite low urban grades, possess strong development potential due to unique natural resource endowment, enjoy development policy incentives, and have high land appreciation gains. Moreover, influenced by factors like city scale, non-state-owned economy, and industrial structure, significant variations exist in local government governance capabilities and policy choices. This manifests directly in differing capacities among local governments for land planning, development, financing, and management, leading to disparities in IIIH among cities of the same grade.
(2) The characteristics of spatial variation in the effect of output value of the tertiary industry on IIIH. The spatial distribution of the regression coefficients in figure 7 shows that regression coefficients generally show an increasing trend from west to east. Except for Lanzhou, Zhangye, Dingxi, Baiyin, Longnan, Tianshui, Jinchang in Gansu Province, Xining, Haidong, Yushu in Qinghai Province, Chamdo in Tibet, and Mianyang in Sichuan Province, which show a negative correlation, all other cities show a positive correlation. This is consistent with existing research showing that tertiary development has a positive effect on the increase in land value (MO et al., 2020). High coefficients cluster in the BG urban agglomeration. For every 1% increase in the output value of the tertiary industry, the IIIH increases by 0.660% to 1.003%. The second highest coefficients are concentrated in the eastern and north-eastern regions. For every 1% increase in the output value of the tertiary industry, the IIIH increases by 0.480% to 0.659%. The development of the tertiary industry has become an important force in stimulating the value-added of idle homesteads.
(3) The characteristics of spatial variation in the effect of health care resources on IIIH. The spatial distribution of the regression coefficients in Figure 8 shows regression coefficients generally increase sequential from south to north. There are 119 cities have positive coefficients, mainly clustered in Gansu, Hebei, Liaoning, Heilongjiang, Jilin, Shandong, Shanxi, Sichuan, Qinghai, Inner Mongolia, Ningxia Hui, and Tibet. For every 1% increase in health care resources, the IIIH increases by 0.001% to 0.233%. These provinces have relatively limited land available for industrial and service sectors, making investments in health care resources highly beneficial with significant positive externalities. Governments prioritize investments in basic public services to narrow regional disparities. Increased health care resources can enhance public service standards, attract population and investment, and further increase the IIIH. The areas with high negative regression coefficients for healthcare resources are mainly concentrated in Guangdong Province and Fujian Province. For every 1% increase in health care resources, the IIIH decreases by 2.011% to -2.663%. These provinces feature highly urbanized land use and abundant healthcare resources. The new investment in health care resources may occupy scarce land resources and reduce the IIIH.
(4) The characteristics of spatial variation in the effect of education funding input on IIIH. The spatial distribution of the regression coefficients in Figure 9 shows that regression coefficients show an increasing trend from northwest to southeast. High negative coefficients are mainly concentrated in Jiangsu and Zhejiang Province. For every 1% decrease in the regression coefficient of education funding input, the IIIH increases by 0.122% to -0.395%. This is primarily because certain cities in Jiangsu and Zhejiang provinces exhibit high dependence on land-related fiscal revenues, distorting and crowding out the “efficiency” of educational investments. Specifically, when a large number of resources are invested in infrastructure projects that can directly and rapidly increase the land price, it will inevitably have a “crowding out effect” on education that needs long-term investment and long return cycle. Furthermore, increases in education inputs may coincide with government efforts to balance budgets by scaling back land market development, thereby revealing a negative correlation. The vast majority of cities have a significant positive effect of education funding inputs on IIIH. Among them, the positive impact is strongest in the PRD and WC urban agglomerations. Neighboring cities of the BG, WC, and PRD Urban Agglomeration show the second highest impact. This indicates that higher education funding input implies greater urban development potential, stronger attractiveness for investment, and higher IIIH.
Robustness test
Spatial lag model
This study employed the LM test to assess the presence of spatial effects. The results indicated that LM-Lag was significant with a P-value of 0.031, thus warranting the adoption of a spatial lag model. The spatial autoregression coefficient was significantly negative with a P-value of 0.022, confirming the existence of a significant negative spatial error correlation within the sample period. Unobserved random shocks in one region can significantly affect the dependent variables in neighboring regions through spatial transmission mechanisms. Therefore, controlling for this spatial effect is necessary to obtain unbiased estimators. After controlling for spatial error effects, the signs of the explanatory variable coefficients largely aligned with the benchmark model’s estimates, and their significance levels remained unchanged, as shown in table 5. This indicates that while the benchmark model may exhibit specification bias due to ignoring spatial effects, its core conclusions regarding the impact of key variables remain reliable and robust.
Instrumental variables method
Selecting appropriate instrumental variables for core explanatory variables is the primary method for addressing endogeneity issues. This study employs the 1988 tertiary industry output value of each city as the instrumental variable. A region’s historical economic structure and developmental foundation exhibit strong path-dependent characteristics. The industrial landscape in 1988 is inevitably highly correlated with the current industrial situation. Simultaneously, historical industrial conditions do not directly influence the present market value of homestead land. It must exert influence indirectly by shaping the current level of economic development. The first-stage test revealed a P-value of 0.000 and an F-statistic of 17.27, exceeding the critical value of 10, indicating strong correlation between the selected instrumental variable and the original independent variable. After accounting for endogeneity, the effect of tertiary industry output value on homestead incremental income remains valid and statistically significant. Furthermore, for testing the null hypothesis of “insufficient instrument identification”, the LM statistic P-value from the Kleibergen-Paap rk test was 0.000, significantly rejecting the null hypothesis. In the weak identification test, the Wald F statistic from Kleibergen-Paap rk exceeded the 10% critical value of 16.38 from the Stock-Yogo weak identification test. These results indicated that after addressing endogeneity through the instrumental variables approach, the conclusions from the benchmark regression remain robust.
DISCUSSION
Under the model of linking the increase and decrease of urban and rural land, obvious regional differences exist in IIIH. Due to regional differences in land value gains, setting an appropriate regulatory tax rate is challenging in some countries with private land ownership, making it difficult to balance developer investment willingness and landowner selling willingness (ZABOROWSKI., 2018; VEJCHODSKÁ et al., 2022; MCALLISTER, 2018; MCALLISTER, 2019). In countries with land systems similar to China’s, such as Vietnam and Cambodia, land increment income primarily stems from direct land acquisition, presenting identical challenges. However, as land laws undergo revision and refinement, restrictions on land use are gradually being imposed. Since Vietnam enacted its new Land Law in 2013, land users have enjoyed more secure rights to land, and the government’s direct expropriation of land use rights has been constrained (MAI, 2020). Cambodia’s 2001 Land Law recognizes private ownership of residential and agricultural land, as well as collective ownership by indigenous communities, while also acknowledging the government’s economic concession rights. Nevertheless, a significant amount of land continues to be directly developed and utilized (PARK, 2018). Therefore, clarifying the spatial distribution pattern and driving mechanism of the IIIH is also crucial for the formulation of policies on the distribution of IIIH and safeguarding farmers’ interests.
We must establish a consensus on farmers’ participation in profit distribution and overcome constraints on their involvement in profit sharing. Simultaneously, we should strengthen the homestead-use right and make farmers’ contributions explicit. The complete regression of the usufructuary property of the right to use homestead is an important basis for scientifically formulating the proportion of farmers’ participation in the distribution of IIIH. First, relevant land management laws should explicitly recognize the property rights nature of farmers’ homestead-use rights. Second, establish a system for calculating the original value of homestead-use right. Finally, create homestead development right to coordinate the increment income distribution among farmers, village collectives and the state.
This study breaks through the spatial limitation of measuring IIIH under the model of linking the increase and decrease of urban and rural land. This study measures the spatial differentiation pattern of IIIH at the national level, deepening the understanding of the problem of IIIH. The conclusions showed that regional IIIH is affected by multiple factors to varying degrees. Therefore, the distribution of IIIH should also consider the differences in various factors and build a differentiated distribution pattern. This study argued that it is possible to construct a differentiated distribution pattern of IIIH based on the ‘policy-driven’, ‘resource-driven’ and ‘economy-driven’ forms. Under the ‘policy-driven’ model, the proportion of IIIH to be distributed should be more favorable to farmers and village collectives. For example, in the pilot reform of homestead land in Gansu, during the process of vacating idle homestead land, the value-added income is prioritized to ensure the construction of new homes and relocation sites for farmers. Under the ‘resource-driven’ and ‘economy-driven’ models, the distribution of IIIH should be equitably distributed among farmers, village collectives and local governments, on the premise of reasonably compensating farmers for withdrawing from idle homesteads. For example, in some tourism-oriented villages in Zhejiang, idle homesteads are transformed into boutique homestays or cultural facilities by collectives or enterprises. The distribution mechanism here typically involves a fair share between farmers (such as rent or dividends), collectives (for infrastructure), and local governments (through taxation), ensuring that unique resources benefit all stakeholders while farmers receive reasonable compensation for their asset exits.
Additionally, under the model of linking the increase and decrease of urban and rural land, some impoverished counties eligible for cross-provincial land quota transactions may face potential risks due to inadequate oversight of transaction quantity, quality, and procedures. These risks included insufficient future development space in impoverished areas, declining land quality, internal manipulation of land transaction prices, and more. It could even exacerbate regional inequality. Therefore, a rigorous risk prevention and control mechanism must be established.
There are some limitations of this study. Using the surplus-value method to measure IIIH in 297 Chinese cities, costs (rural housing demolition, land reclamation, land acquisition, and “five availables and one leveling” were classified into four grades by urban grade. While this division simplifies measurement considering inter-city labor and material costs variability, it can result in a certain degree of measurement error. In future research, we should try to obtain cost-benefit data from multiple sources for each city’s project of linking the increase and decrease of urban and rural land, to reduce the measurement error.
CONCLUSION
This study empirically measures the IIIH, and clarifies its spatial differentiation characteristics and the spatial heterogeneity of its influencing factors. The main conclusions are as follows: (1) IIIH in China is significant. The IIIH in the province shows a pattern of spatial clustering and differentiation. The provinces with high IIIH are clustered in the eastern region, and the provinces with low IIIH are clustered in the western region. The average value of IIIH base in all provinces is $4,466,651 per hectare. The IIIH in the municipal area show regional spatial agglomeration differences and administrative hierarchy differences. Cities with high IIIH are concentrated in the YRD, PRD, Chengdu-Chongqing and Bohai Rim urban agglomerations. The Cities with low IIIH are concentrated in inland areas. The IIIH in provincial capital cities and cities with separate programmers are higher than those in general prefecture-level cities. At the same time, the IIIH in the municipal area are characterized by obvious spatial correlations. (2) Factors affecting IIIH, such as location conditions, capital investment, land use, supply and demand, and policy interventions, play different roles in different IIIH formation modes. (3) Urban grade, the output value of tertiary industry, health care resources and education funding input have a significant effect on the IIIH, and the effect is characterized by spatial variability. Their regression coefficients show increasing trends from north to south, west to east, south to north and northwest to southeast, respectively.
ACKNOWLEDGMENTS
This research was supported by the Hebei Social Science foundation of China (HB24YJ003).
REFERENCES
-
DEBARSHI, D. Marxist rent theory and its applications in developing countries. Science & Society, v.87, p.531-555, 2023. Available from: <Available from: https://www.webofscience.com/wos/woscc/full-record/WOS:001086907200004 >. Accessed: Apr. 07, 2025. doi: 10.1521/siso.2023.87.4.531.
» https://doi.org/10.1521/siso.2023.87.4.531.» https://www.webofscience.com/wos/woscc/full-record/WOS:001086907200004 -
DOU, Y. et al. An empirical study on transit-oriented low-carbon urban land use planning: Exploratory spatial data analysis (ESDA) on Shanghai, China. Habitat International, v.53, p.379-389, 2016. Available from: <Available from: https://www.sciencedirect.com/science/article/abs/pii/S0197397515301594?via%3Dihub >. Accessed: Apr. 07, 2025. doi: 10.1016/j.habitatint.2015.12.005.
» https://doi.org/10.1016/j.habitatint.2015.12.005.» https://www.sciencedirect.com/science/article/abs/pii/S0197397515301594?via%3Dihub -
ECONOMAKIS, G. E. On absolute rent: theoretical remarks on Marx’s analysis. Science & Society, v.67, p.339-348, 2003. Available from: <Available from: https://openurl.ebsco.com/EPDB%3Agcd%3A2%3A18409058/detailv2?sid=ebsco%3Aplink%3Acrawler&id=ebsco%3Agcd%3A11087472&crl=f&link_origin=none >. Accessed: Apr. 08, 2025. doi: 10.1521/siso.67.3.329.21241a.
» https://doi.org/10.1521/siso.67.3.329.21241a.» https://openurl.ebsco.com/EPDB%3Agcd%3A2%3A18409058/detailv2?sid=ebsco%3Aplink%3Acrawler&id=ebsco%3Agcd%3A11087472&crl=f&link_origin=none -
ESHETU, S. B. et al. Financial analysis of smallholder farmers woodlot and homestead agroforestry systems and its implications for household income improvement, the case of Hawassa Zuria district, Southern Ethiopia. Journal of Agricultural Science Food and Research, v.9, p.1000236, 2018. Available from: <Available from: https://www.researchgate.net/publication/330513842_financial-analysis-of-smallholder-farmers-woodlot-and-homestead-agroforestry-systems-and-its-implications-for-household-income-imp >. Accessed: Apr. 07, 2025. doi: 10.1007/s10457-012-9537-1.
» https://doi.org/10.1007/s10457-012-9537-1.» https://www.researchgate.net/publication/330513842_financial-analysis-of-smallholder-farmers-woodlot-and-homestead-agroforestry-systems-and-its-implications-for-household-income-imp -
FANG, S. C. et al. Factors affecting the price of cost-equivalent land: application of hierarchical linear modeling. Land, v.7, p.684, 2021. Available from: <Available from: https://www.mdpi.com/2073-445X/10/7/684 >. Accessed: Apr. 08, 2025. doi: 10.3390/land10070684.
» https://doi.org/10.3390/land10070684.» https://www.mdpi.com/2073-445X/10/7/684 -
GAO, J. L. et al. China’s initiatives towards rural land system reform. Land Use Policy, v.94, p.104567, 2020. Available from: <Available from: https://linkinghub.elsevier.com/retrieve/pii/S0264837719323981 >. Accessed: Apr. 08, 2025. doi: 10.1016/j.landusepol.2020.104567.
» https://doi.org/10.1016/j.landusepol.2020.104567.» https://linkinghub.elsevier.com/retrieve/pii/S0264837719323981 -
GUO, B. et al. Analysis of influencing factors of farmers’ homestead revitalization intention from the perspective of social capital. Land, v.12, p.812, 2023. Available from: <Available from: https://www.mdpi.com/2073-445X/12/4/812 >. Accessed: Apr. 07, 2025. doi: 10.3390/land12040812.
» https://doi.org/10.3390/land12040812.» https://www.mdpi.com/2073-445X/12/4/812 -
HAN, W. et al. Land use regulation and urban land value: Evidence from China. Land Use Policy, v.92, p.104432, 2020. Available from: <Available from: https://www.sciencedirect.com/science/article/abs/pii/S0264837719310841?via%3Dihub >. Accessed: Apr. 08, 2025. doi: 10.1016/j.landusepol.2019.104432.
» https://doi.org/10.1016/j.landusepol.2019.104432.» https://www.sciencedirect.com/science/article/abs/pii/S0264837719310841?via%3Dihub -
HU, C. On the distribution of value-added income of homestead under the “Separation of Three Rights”. The Frontiers of Society, Science and Technology, v.5, p.101-110, 2023. Available from: <Available from: https://francis-press.com/papers/9544 >. Accessed: Apr. 07, 2025. doi: 10.25236/FSST.2023.050317.
» https://doi.org/10.25236/FSST.2023.050317.» https://francis-press.com/papers/9544 -
KONG, X. et al. A novel framework for rural homestead land transfer under collective ownership in China. Land Use Policy, v.78, p.138-146, 2018. Available from: <Available from: https://www.sciencedirect.com/science/article/abs/pii/S0264837716314144?via%3Dihub >. Accessed: Apr. 08, 2025. doi: 10.1016/j.landusepol.2018.06.046.
» https://doi.org/10.1016/j.landusepol.2018.06.046.» https://www.sciencedirect.com/science/article/abs/pii/S0264837716314144?via%3Dihub -
LIU, Y. L. et al. A comparative analysis of urban and rural construction land use change and driving forces: Implications for urban-rural coordination development in Wuhan, Central China. Habitat International, v.47, p.113-124, 2015. Available from: <Available from: https://www.sciencedirect.com/science/article/abs/pii/S0197397515000132?via%3Dihub >. Accessed: Apr. 08, 2025. doi: 10.1016/j.habitatint.2015.01.012.
» https://doi.org/10.1016/j.habitatint.2015.01.012.» https://www.sciencedirect.com/science/article/abs/pii/S0197397515000132?via%3Dihub -
MAI, T. T. D. Land conversion for tourism development under Vietnam’s ambiguous property rights over Land. Land, v.9, p.204, 2020. Available from: <Available from: https://www.mdpi.com/2073-445X/9/6/204 >. Accessed: Apr. 09, 2025. doi: 10.3390/land9060204.
» https://doi.org/10.3390/land9060204.» https://www.mdpi.com/2073-445X/9/6/204 -
MCALLISTER, P. Policy shifts, developer contributions and land value capture in London 2005-2017. Land use policy, v.78, p.316-326, 2018. Available from: <Available from: https://www.sciencedirect.com/science/article/abs/pii/S0264837717315624?via%3Dihub >. Accessed: Apr. 09, 2025. doi: 10.1016/j.landusepol.2018.06.047.
» https://doi.org/10.1016/j.landusepol.2018.06.047.» https://www.sciencedirect.com/science/article/abs/pii/S0264837717315624?via%3Dihub -
MCALLISTER, P. The taxing problems of land value capture, planning obligations and viability tests: some reasonable models. Town planning review, v.90, p.429-451, 2019. Available from: <Available from: https://www.liverpooluniversitypress.co.uk/doi/10.3828/tpr.2019.28 >. Accessed: Apr. 08, 2025. doi: 10.3828/tpr.2019.28.
» https://doi.org/10.3828/tpr.2019.28.» https://www.liverpooluniversitypress.co.uk/doi/10.3828/tpr.2019.28 -
MO, Y. et al. Spatial differentiation patterns and influencing factors of urban land prices in Yangtze River economic belt. Resources and Environment in the Yangtze River, v.29, p.13-22, 2020. Available from: <Available from: https://kns.cnki.net/kcms2/t?v=iLvembebNjzub5sSHDR7AJJYEExKsqGTjwwruy3DkqAtnUV9RwRVt8RzNl76iZHEX3PEXlwtx69u9BC9nsbLmmguvtmgd6BKYYKNDfTVVMuuwKN7gOeVxZRZTK400r9A8fzqMRPr9kOes0YTeGTisS291SKhh2mf_u4UB1OsNjWM4De8r5XFjDprKxVcvsbzcewoqgUk4qTvTfwtw==&uniplatform=NZKPT >. Accessed: Apr. 08, 2025.
» https://kns.cnki.net/kcms2/t?v=iLvembebNjzub5sSHDR7AJJYEExKsqGTjwwruy3DkqAtnUV9RwRVt8RzNl76iZHEX3PEXlwtx69u9BC9nsbLmmguvtmgd6BKYYKNDfTVVMuuwKN7gOeVxZRZTK400r9A8fzqMRPr9kOes0YTeGTisS291SKhh2mf_u4UB1OsNjWM4De8r5XFjDprKxVcvsbzcewoqgUk4qTvTfwtw==&uniplatform=NZKPT -
PARK, C. M. Y. “Our lands are our lives”: Gendered experiences of resistance to Land grabbing in rural cambodia. Feminist Economics, v.25, p.21-44, 2018. Available from: <Available from: https://www.tandfonline.com/doi/full/10.1080/13545701.2018.1503417 >. Accessed: Apr. 08, 2025. doi: 10.1080/13545701.2018.1503417.
» https://doi.org/10.1080/13545701.2018.1503417.» https://www.tandfonline.com/doi/full/10.1080/13545701.2018.1503417 -
PAT, M. et al. Policy shifts, developer contributions and land value capture in London 2005-2017. Land use policy, v.78, p.316-326, 2018. Available from: <Available from: https://www.sciencedirect.com/science/article/abs/pii/S0264837717315624 >. Accessed: Apr. 07, 2025. doi: 10.1016/j.landusepol.2018.06.047.
» https://doi.org/10.1016/j.landusepol.2018.06.047.» https://www.sciencedirect.com/science/article/abs/pii/S0264837717315624 -
PERCIVAL, J. E. H. et al. Exploratory spatial data Analysis with gwpcorMapper: an interactive mapping tool for geographically weighted correlation and partial correlation. Journal of Geovisualization and Spatial Analysis, v.6, p.17, 2022. Available from: <Available from: https://webofscience.clarivate.cn/wos/woscc/full-record/WOS:000803910000001 >. Accessed: Apr. 08, 2025. doi: 10.1007/s41651-022-00111-3.
» https://doi.org/10.1007/s41651-022-00111-3.» https://webofscience.clarivate.cn/wos/woscc/full-record/WOS:000803910000001 -
QI, W. et al. Response mechanism of farmers’ livelihood capital to the compensation for rural homestead withdrawal - empirical evidence from Xuzhou city, China. Land, v.11, p.2149, 2022. Available from: <Available from: https://www.mdpi.com/2073-445X/11/12/2149 >. Accessed: Apr. 08, 2025. doi: 10.3390/land11122149.
» https://doi.org/10.3390/land11122149.» https://www.mdpi.com/2073-445X/11/12/2149 -
TAKENAGA, S. Marx on rent: new insights from the new MEGA. The European Journal of the History of Economic Thought, v.25, p.926-960, 2018. Available from: <Available from: https://www.tandfonline.com/doi/full/10.1080/09672567.2018.1523936?needAccess=true >. Accessed: Apr. 07, 2025. doi: 10.1080/09672567.2018.1523936.
» https://doi.org/10.1080/09672567.2018.1523936.» https://www.tandfonline.com/doi/full/10.1080/09672567.2018.1523936?needAccess=true -
TIAN, G J. et al. Spatial-temporal charactristics and transfer modes of rural homestead in China. Habitat International , v.155, p.103230, 2024. Available from: <Available from: https://www.sciencedirect.com/science/article/abs/pii/S0197397524002303?getft_integrator=clarivate&pes=vor&utm_source=clarivate >. Accessed: Apr. 08, 2025. doi: 10.1016/j.habitatint.2024.103230.
» https://doi.org/10.1016/j.habitatint.2024.103230.» https://www.sciencedirect.com/science/article/abs/pii/S0197397524002303?getft_integrator=clarivate&pes=vor&utm_source=clarivate -
VEJCHODSKÁ, E. et al. Bridging land value capture with land rent narratives. Land Use Policy, v.114, p.105956, 2022. Available from: <Available from: https://www.sciencedirect.com/science/article/pii/S0264837721006797?via%3Dihub >. Accessed: Apr. 08, 2025. doi: 10.1016/j.landusepol.2021.105956.
» https://doi.org/10.1016/j.landusepol.2021.105956.» https://www.sciencedirect.com/science/article/pii/S0264837721006797?via%3Dihub -
WANG, L. et al. Exploring changes and influencing factors of farmers’ welfare in different villages under the background of homestead system reform. Habitat International, v.153, 9.103190, 2024. Available from: <Available from: https://www.sciencedirect.com/science/article/abs/pii/S0197397524001905?via%3Dihub >. Accessed: Apr. 08, 2025. doi: 10.1016/j.habitatint.2024.103190.
» https://doi.org/10.1016/j.habitatint.2024.103190.» https://www.sciencedirect.com/science/article/abs/pii/S0197397524001905?via%3Dihub -
WANG, Y.; BADDELEY, M. The problem of land value betterment: a simplified agent-based test. Annals of Regional Science, v.57, p.413-436, 2016. Available from: <Available from: https://link.springer.com/article/10.1007/s00168-015-0675-z >. Accessed: Apr. 07, 2025. doi: 10.1007/s00168-015-0675-z.
» https://doi.org/10.1007/s00168-015-0675-z.» https://link.springer.com/article/10.1007/s00168-015-0675-z -
WANG, Y. F.; LI, T. T. Behavioural selection of farmer households for rural homestead use in China: Self-occupation and transfer. Habitat International, v.152, p.103163, 2024. Available from: <Available from: https://www.sciencedirect.com/science/article/abs/pii/S0197397524001632?via%3Dihub >. Accessed: Apr. 07, 2025. doi: 10.1016/j.habitatint.2024.103163.
» https://doi.org/10.1016/j.habitatint.2024.103163.» https://www.sciencedirect.com/science/article/abs/pii/S0197397524001632?via%3Dihub -
XIE, Y. et al. Psychological resilience and farmers’ homestead withdrawal: evidence from traditional agricultural regions in China. Agriculture, v.13, p.1044, 2023. Available from: <Available from: https://www.mdpi.com/2077-0472/13/5/1044 >. Accessed: Apr. 07, 2025. doi: 10.3390/agriculture13051044.
» https://doi.org/10.3390/agriculture13051044.» https://www.mdpi.com/2077-0472/13/5/1044 -
YANG, L. X. et al. Balanced distribution of the increment income from the listing of rural homestead under the perspective of shared development. Chin. Theoretical Exploration, v.35, p.92-97, 2018. Available from: <Available from: https://kns.cnki.net/kcms2/article/abstract?v=aBsOvapnXdUVonbWRsdr1Pv5ORa7q534fIZb0raSpe6hs9CNQ_qwYdMF6O84AecffUh7ozDirq8gmmYLYV62z0QhM5fNZxFfMmSg2ffT6-V3jMb2Ie6WbN0LZfhyfuX4ORpfHdhKHDIwD6Klksh3t2RRIdzRKAEoxIOleWAbYaefz99cA_bpux0V0vCEcfaEUJdF9yC092VsIBvLES5WGw==&uniplatform=NZKPT >. Accessed: Apr. 07, 2025.
» https://kns.cnki.net/kcms2/article/abstract?v=aBsOvapnXdUVonbWRsdr1Pv5ORa7q534fIZb0raSpe6hs9CNQ_qwYdMF6O84AecffUh7ozDirq8gmmYLYV62z0QhM5fNZxFfMmSg2ffT6-V3jMb2Ie6WbN0LZfhyfuX4ORpfHdhKHDIwD6Klksh3t2RRIdzRKAEoxIOleWAbYaefz99cA_bpux0V0vCEcfaEUJdF9yC092VsIBvLES5WGw==&uniplatform=NZKPT -
YUAN, Z. et al. Citizenship ability, homestead utility, and rural homestead transfer of “Amphibious” farmers. Sustainability, v.14, p.2067, 2022. Available from: <Available from: https://www.mdpi.com/2071-1050/14/4/2067 >. Accessed: Apr. 08, 2025. doi: 10.3390/su14042067.
» https://doi.org/10.3390/su14042067.» https://www.mdpi.com/2071-1050/14/4/2067 -
ZABOROWSKI, T. Land acquisition and land value capture instruments as determinants of public urban infrastructure provision: A comparison of the Polish legal framework with its German counterpart. Geographia Polonica, v.91, p.353-369, 2018. Available from: <Available from: https://rcin.org.pl/igipz/dlibra/publication/86058 >. Accessed: Apr. 07, 2025. doi: 10.7163/GPol.0125.
» https://doi.org/10.7163/GPol.0125.» https://rcin.org.pl/igipz/dlibra/publication/86058 -
ZHAO, Q. Y. et al. Unpacking the effects of rural homestead development rights reform on rural revitalization in China. Journal of Rural Studies, v.108, p.103265, 2024. Available from: <Available from: https://www.sciencedirect.com/science/article/pii/S074301672400069X?via%3Dihub >. Accessed: Apr. 07, 2025. doi: 10.1016/j.jrurstud.2024.103265.
» https://doi.org/10.1016/j.jrurstud.2024.103265.» https://www.sciencedirect.com/science/article/pii/S074301672400069X?via%3Dihub -
ZOU, X. et al. Distribution of incremental land revenue since the founding of the communist party of China (CPC): policy evolution, theoretical argument and reform logic. Chin. China Land Sciences, v.35, p.15-22, 2021. Available from: <Available from: https://kns.cnki.net/kcms2/article/abstract?v=aBsOvapnXdXvPGVYx6mt2gG3vkVeTWRufwPboiTilVfWzJq6j-GvoRNRFmrOYhcdhrp0c1GNOn-mub5heGnNHoXumA-UyxuKXbkWaMhiStIyurhQNWQM0Xrv5k4ztwDLNvgdMdJWEXs5kE5kHksXMKAeHyCgWT1e64UXg8dF_SMnSnmVujiIM5-50UXtRKLIPAcRjol6XaQ==&uniplatform=NZKPT >. Accessed: Apr. 08, 2025.
» https://kns.cnki.net/kcms2/article/abstract?v=aBsOvapnXdXvPGVYx6mt2gG3vkVeTWRufwPboiTilVfWzJq6j-GvoRNRFmrOYhcdhrp0c1GNOn-mub5heGnNHoXumA-UyxuKXbkWaMhiStIyurhQNWQM0Xrv5k4ztwDLNvgdMdJWEXs5kE5kHksXMKAeHyCgWT1e64UXg8dF_SMnSnmVujiIM5-50UXtRKLIPAcRjol6XaQ==&uniplatform=NZKPT
Edited by
-
ASSOCIATE EDITOR:
Leandro Souza da Silva (0000-0002-1636-6643)
-
SCIENTIFIC EDITOR:
Raquel Breitenbach (0000-0002-9431-3766)
Data may be available on request.